ProActive Quickstart - Machine Learning Workflows
ProActive AI Orchestration (PAIO) is an interactive graphical interface that enables developers and data scientists to quickly and easily build, train, and deploy machine learning models at any scale. It provides a rich set of generic machine learning tasks that can be connected together to build basic and complex machine learning workflows for various use cases such as: fraud detection, text analysis, online offer recommendations, prediction of equipment failures, facial expression analysis, etc. These tasks are open source and can be easily customized according to your needs. PAIO can schedule and orchestrate executions while optimising the use of computational resources. Usage of resources (e.g. CPU, GPU, local, remote nodes) can be quickly monitored.
This tutorial will show you how to:
- Build a machine learning workflow for diabetics detection using generic machine learning tasks.
- Submit it to the scheduler and monitor its execution.
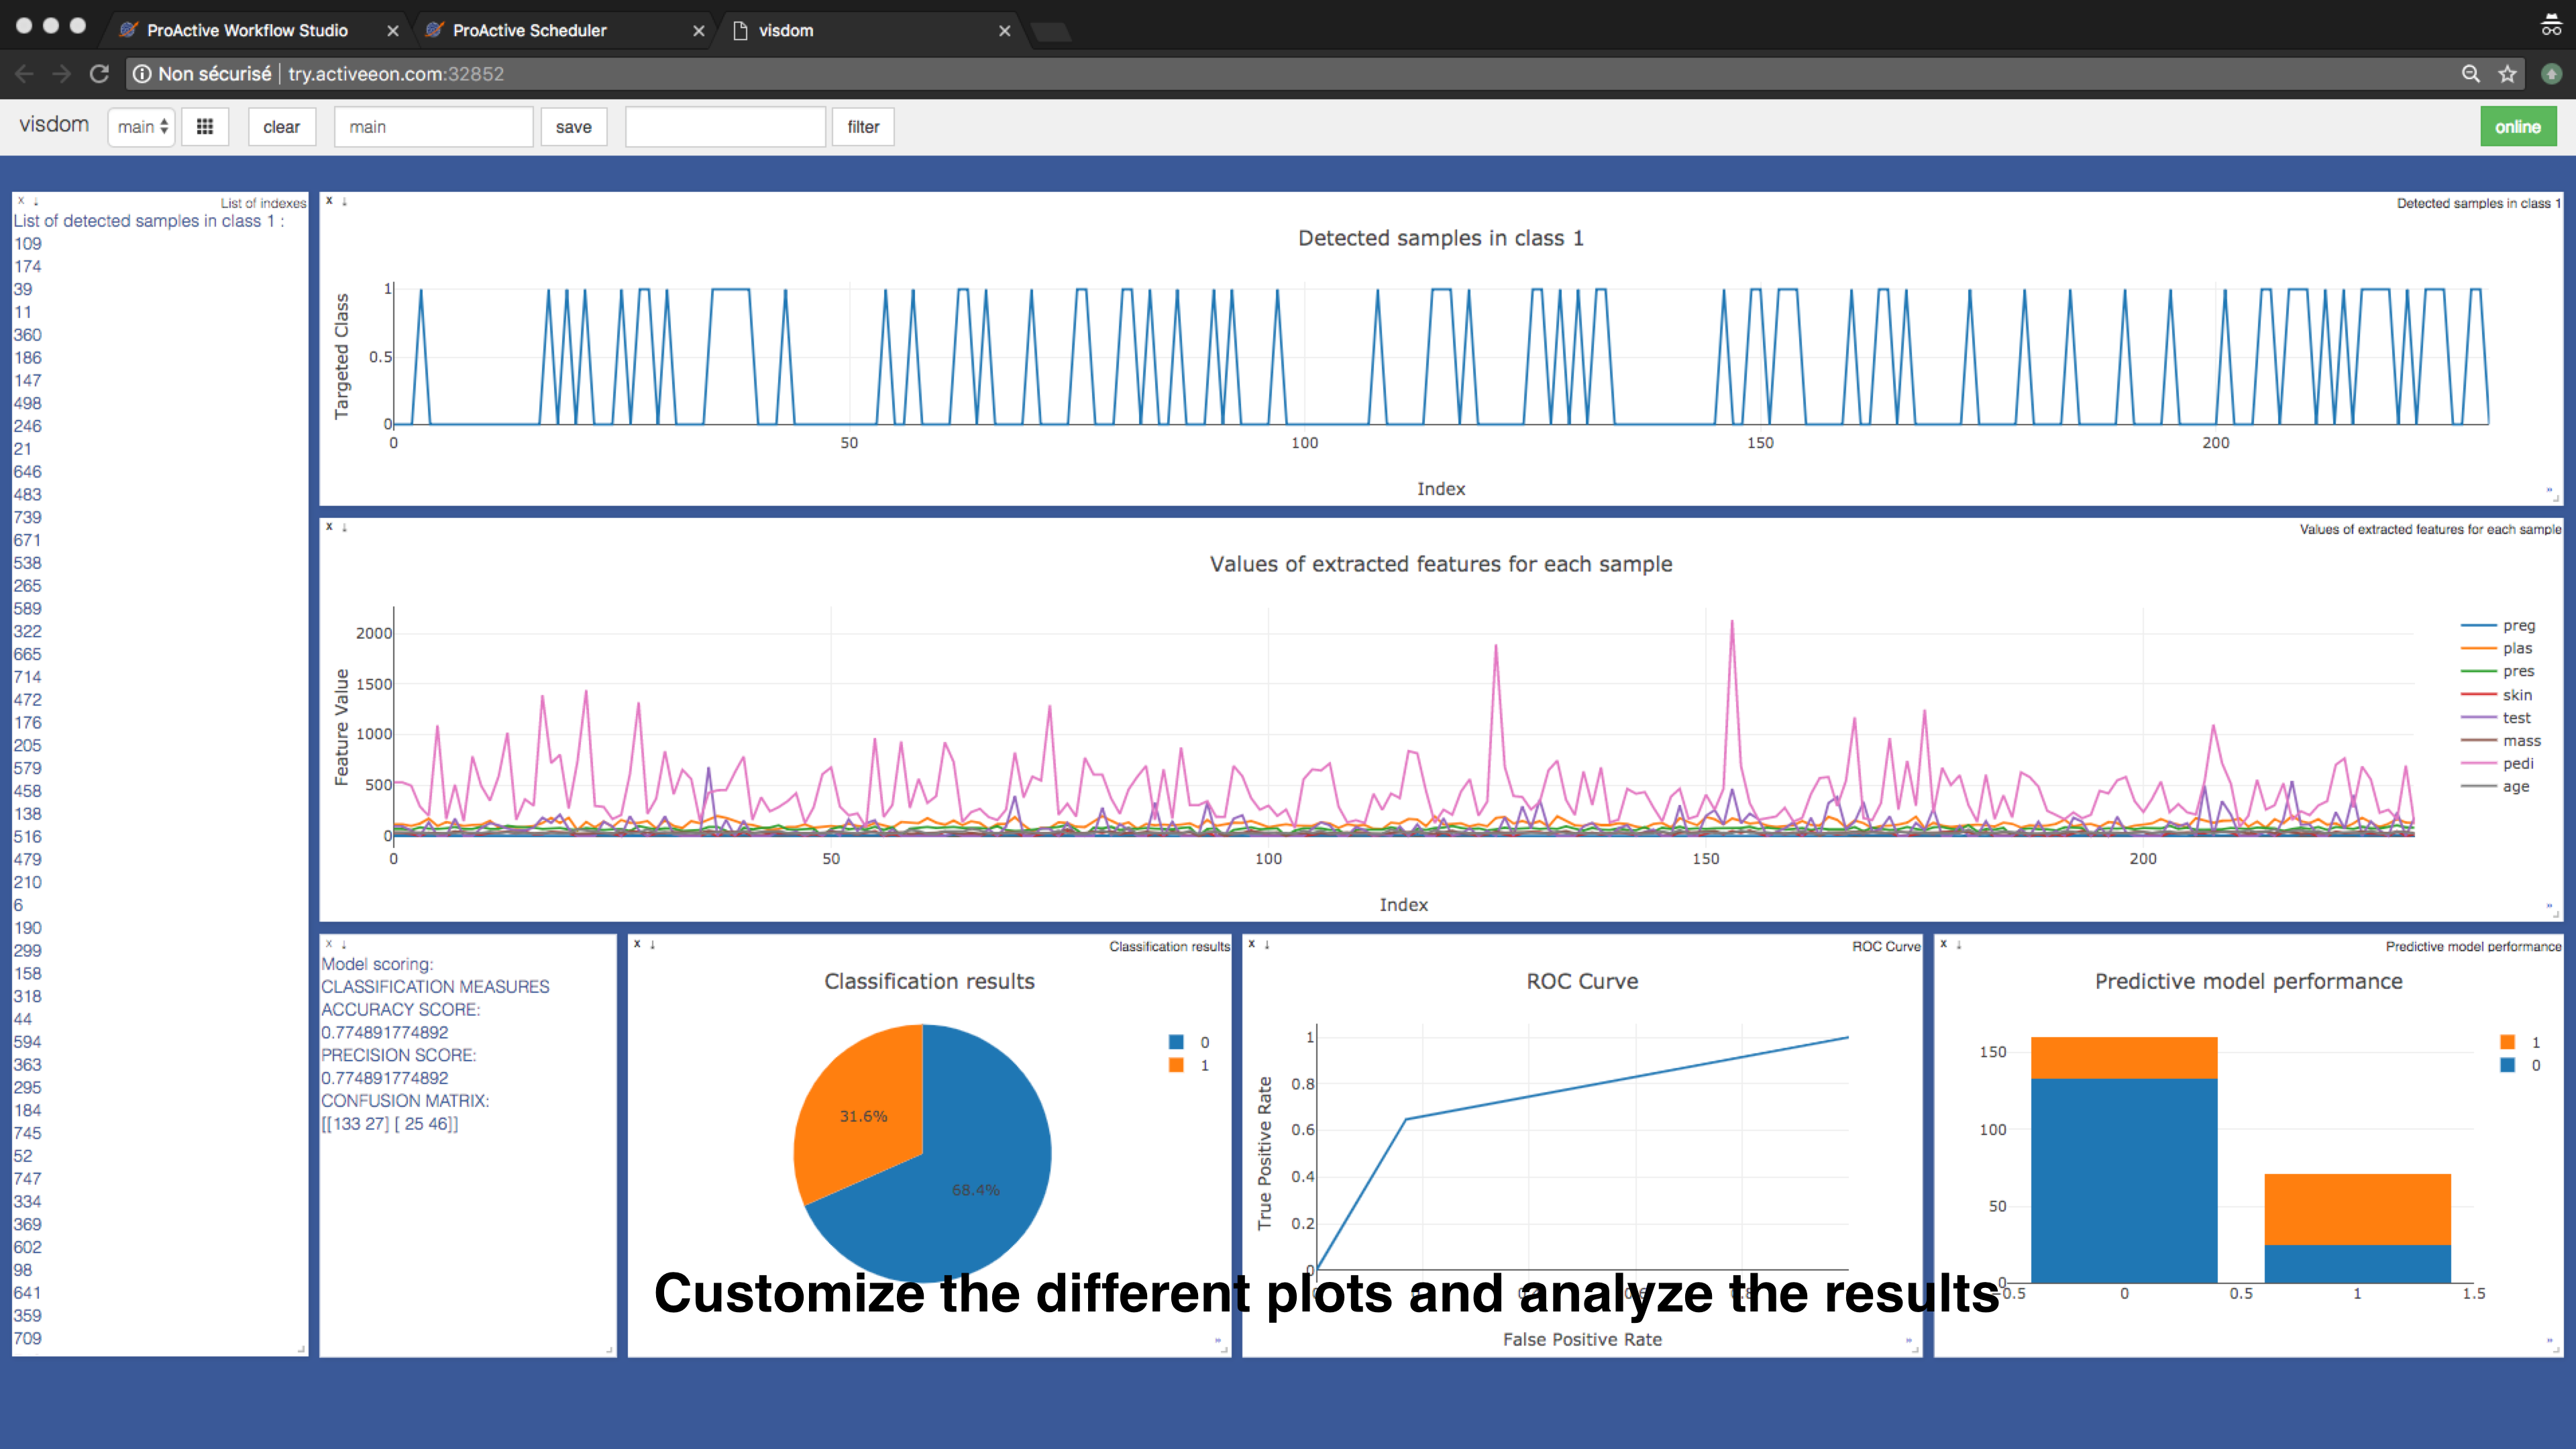
- Visualize prediction results using Visdom.
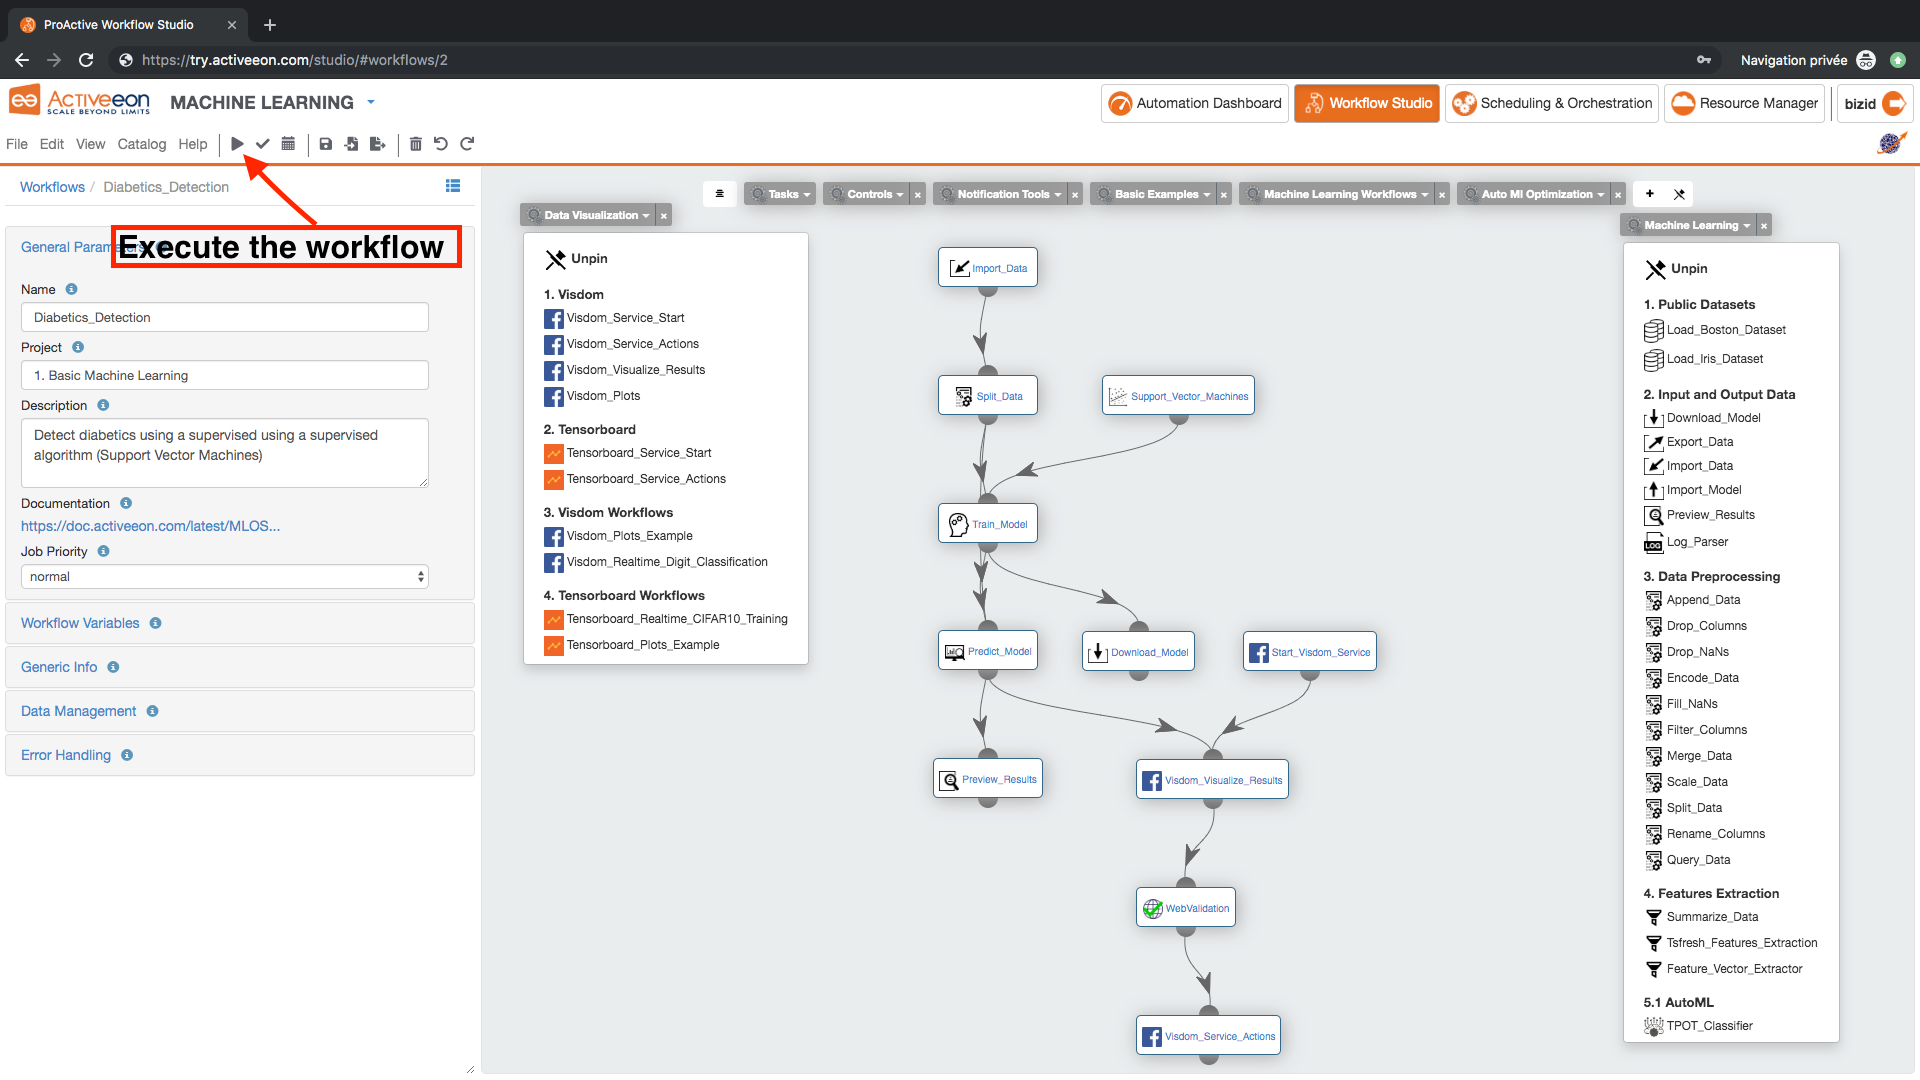
1 Customize the Canvas
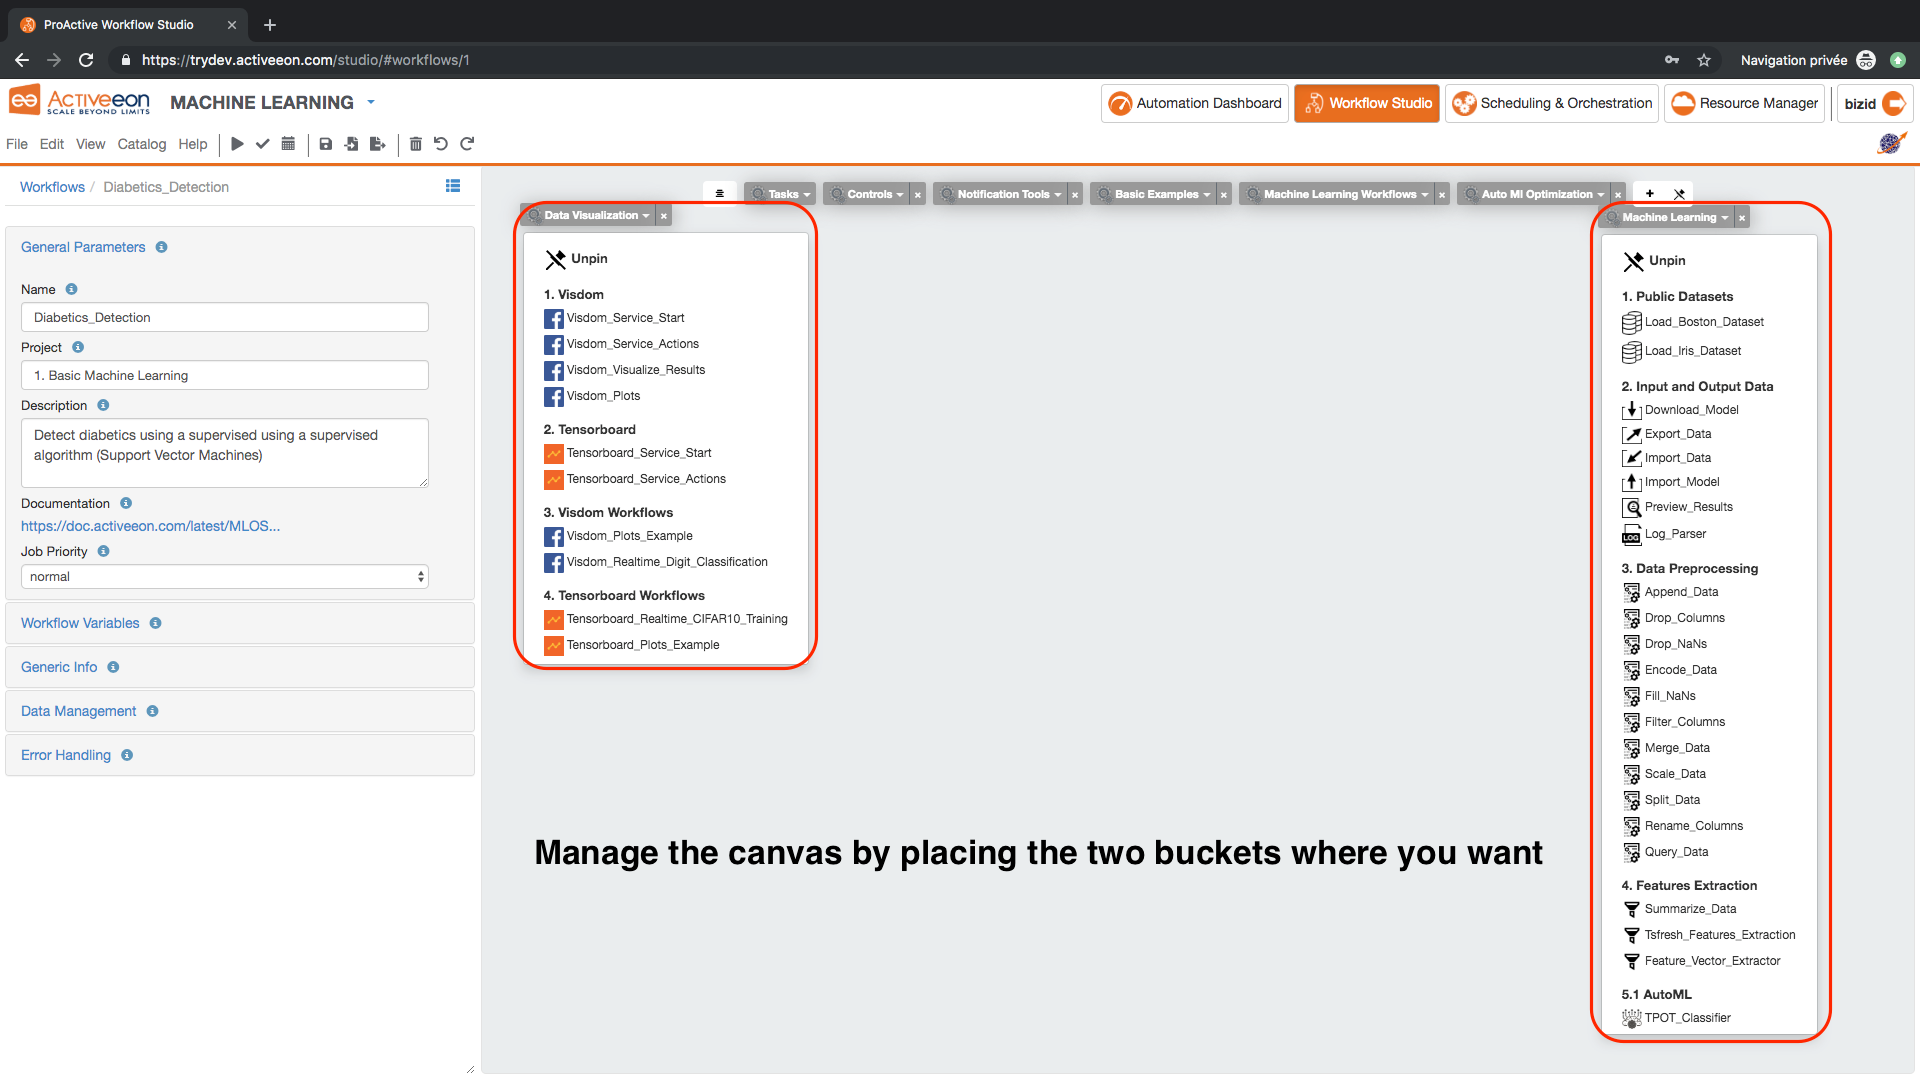
Manage the Canvas to be able to easily drag and drop machine any task in the learning and data visualisation buckets.
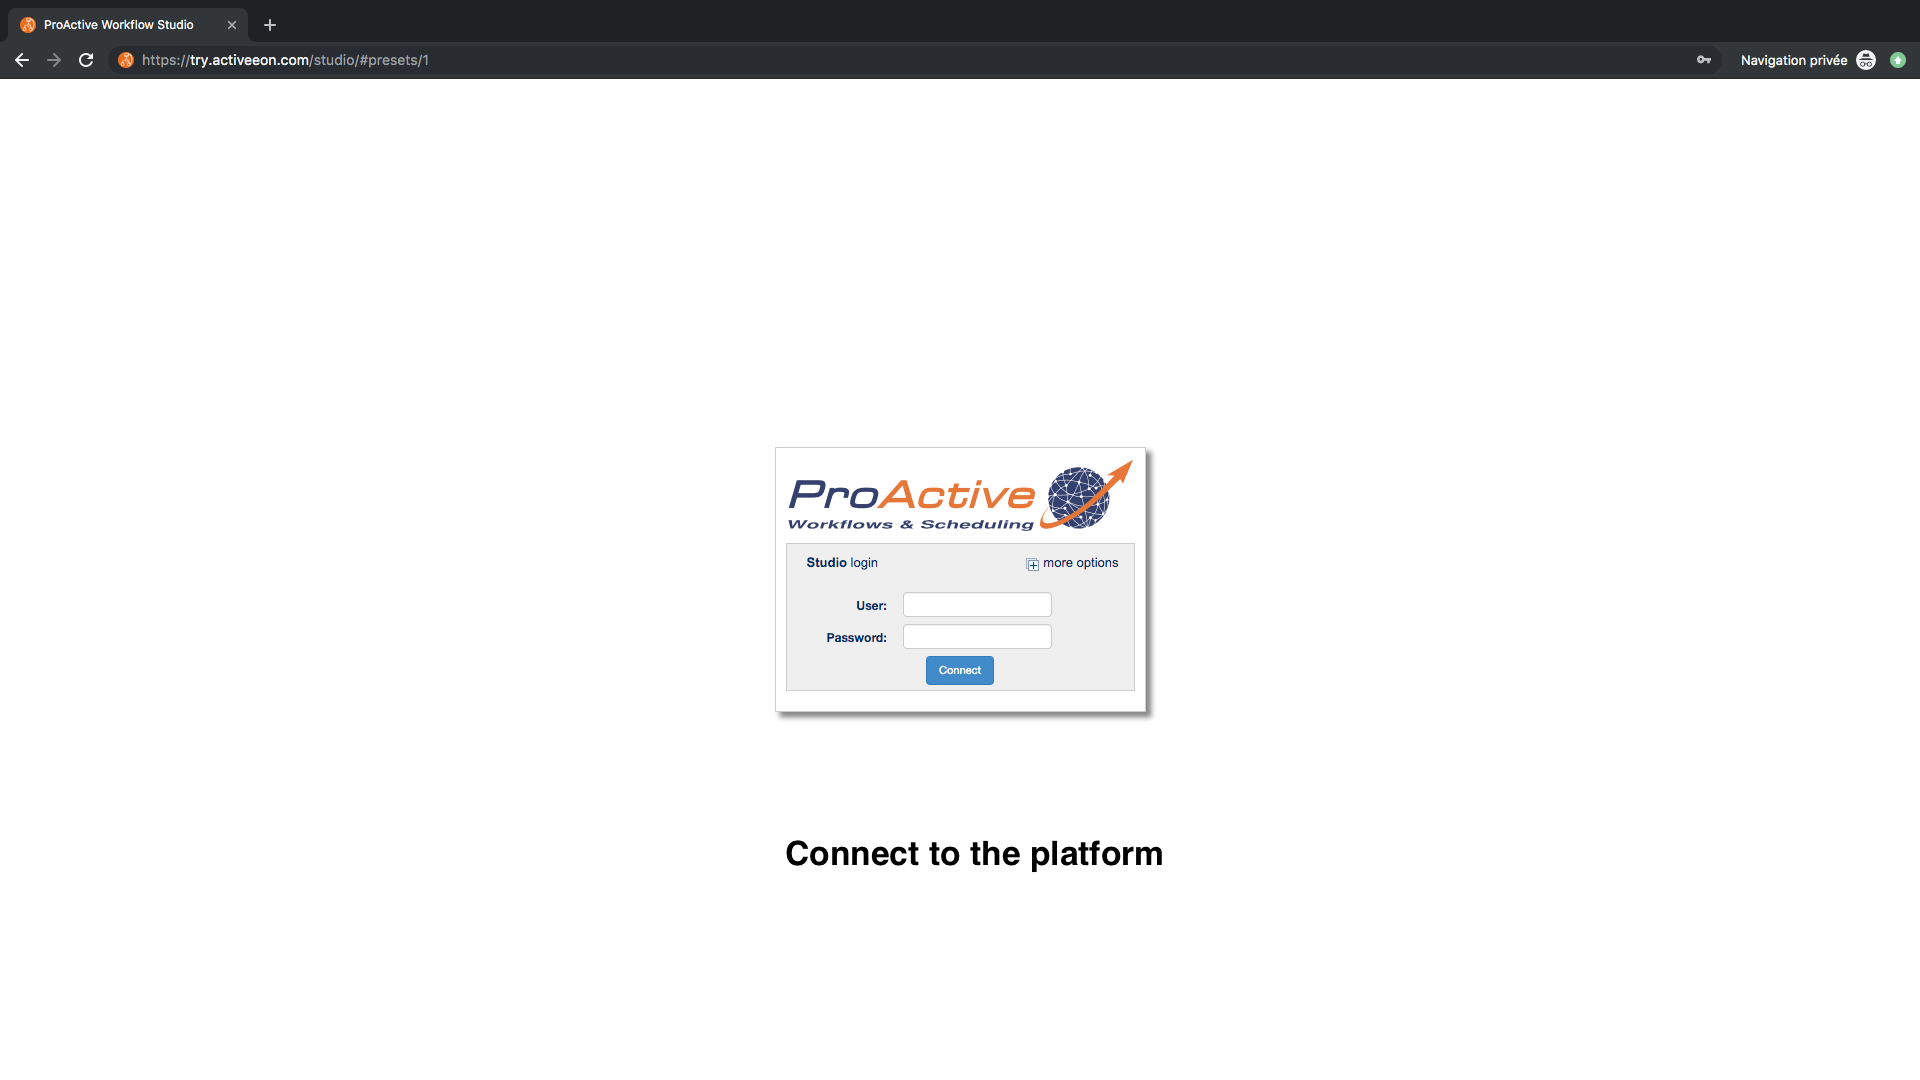
- Open ProActive Workflow Studio home page.
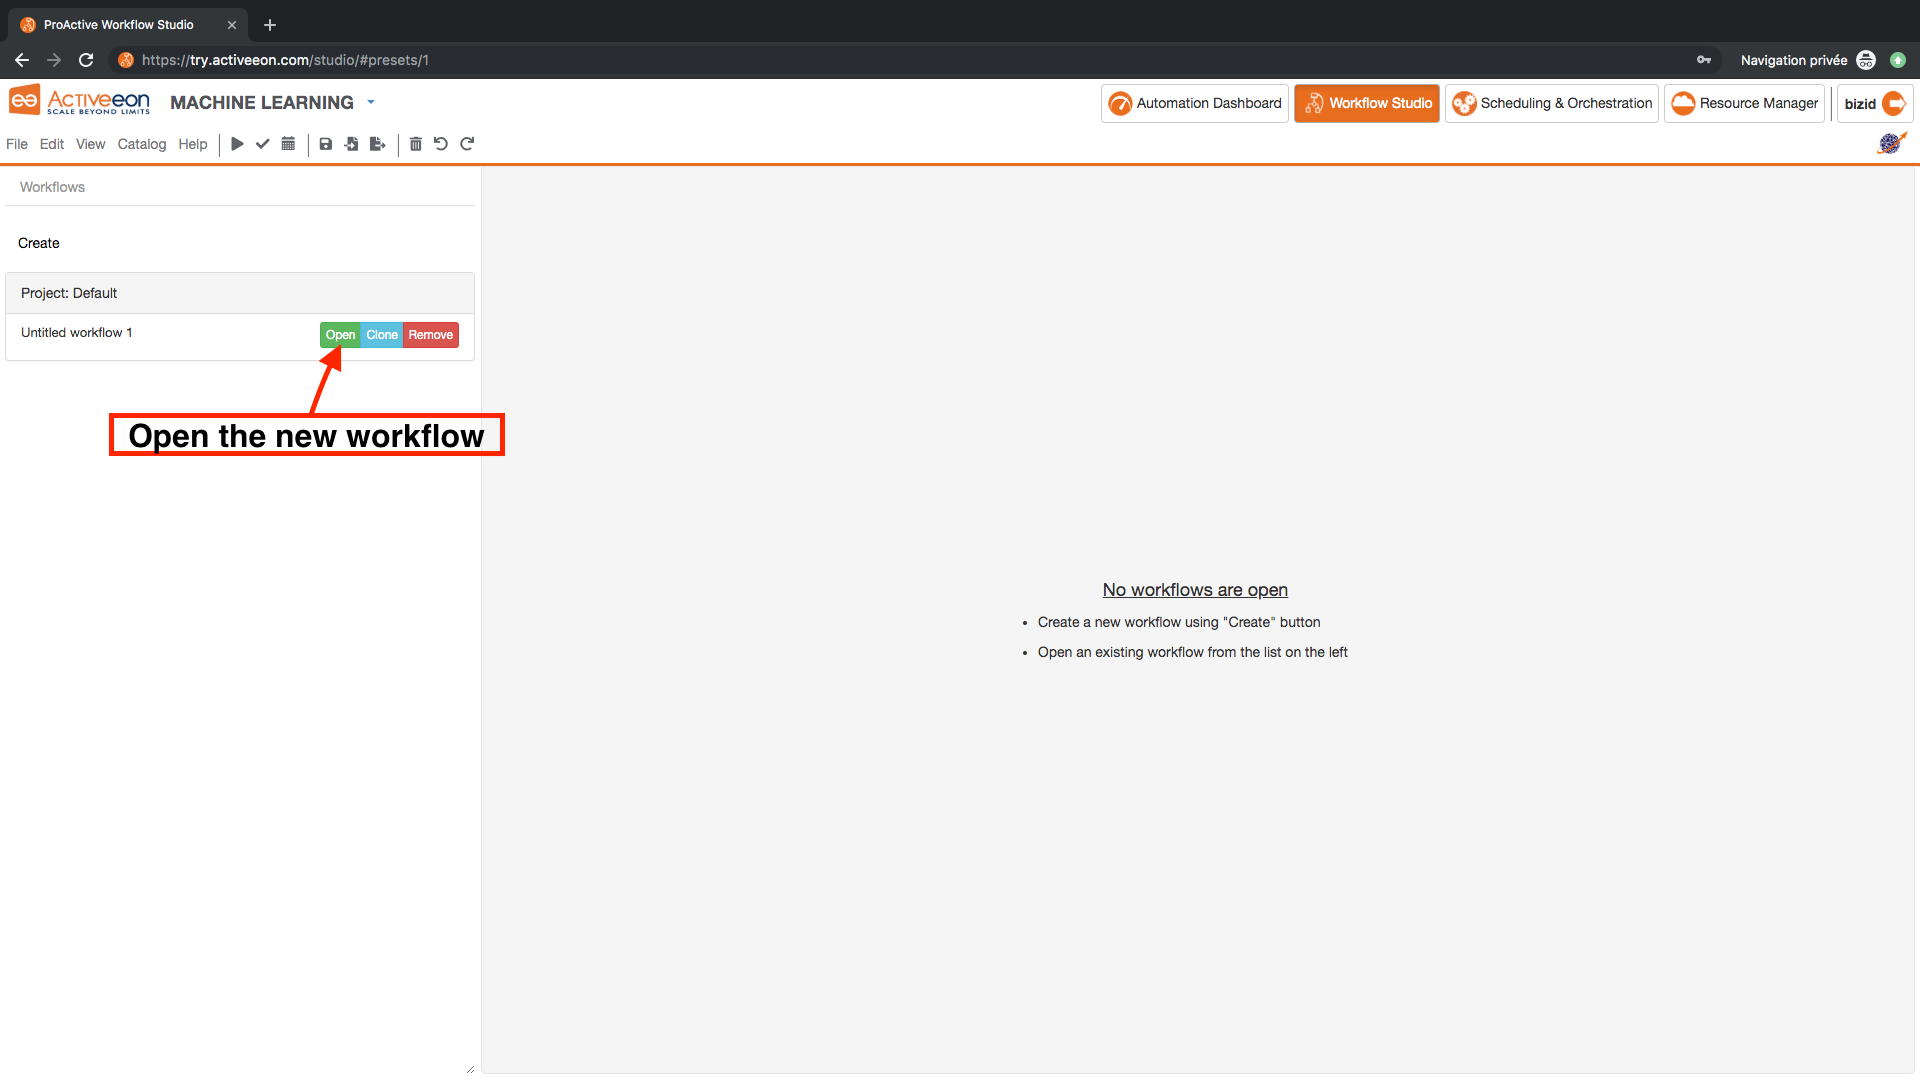
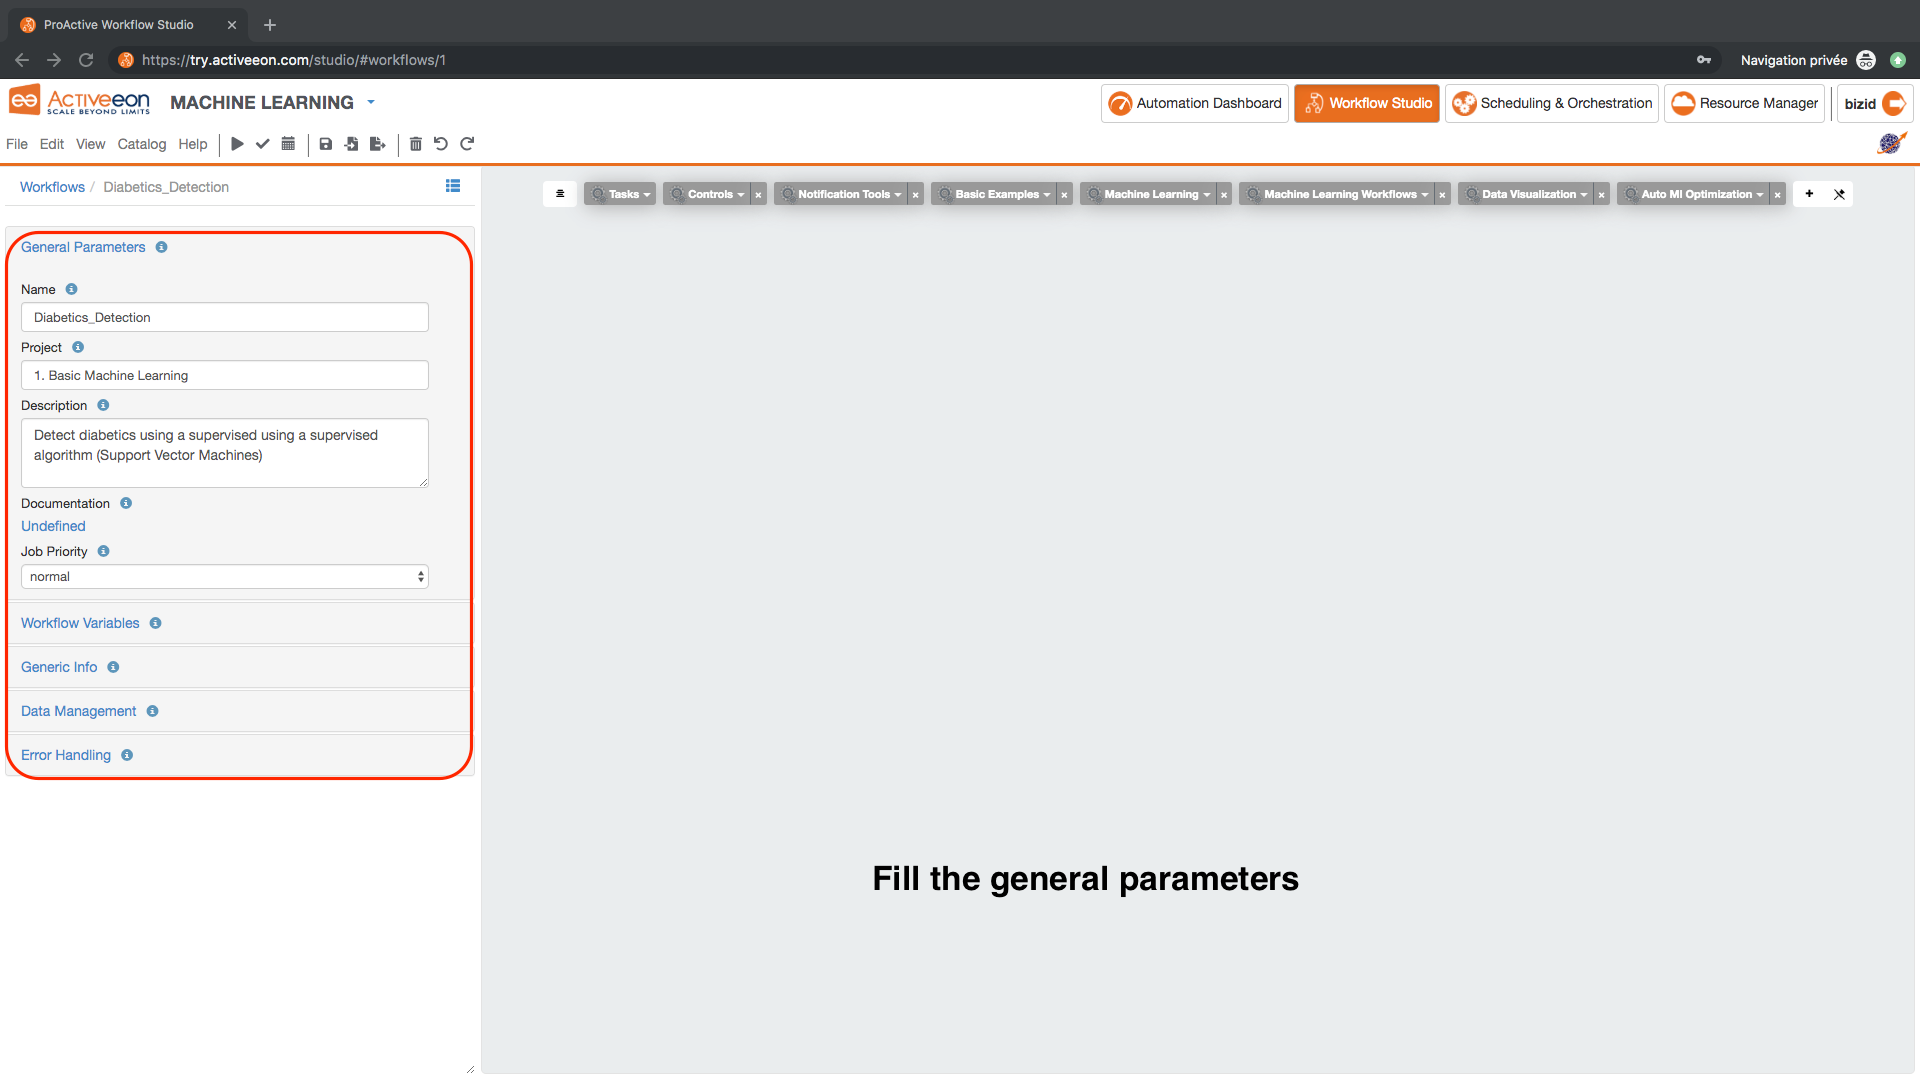
- Create a new workflow and fill the general parameters.
- Move and unpin the machine learning and data visualisation in order to organize the canvas.
2 Build the Diabetics Detection Workflow
- Drag and drop the following tasks from each bucket:
- Machine Learning Bucket:
Import_Data task from 2. Input and Output Data. This task imports any data stored in a csv file. It uses by default the Pima Indians Diabetics dataset available on this link: https://s3.eu-west-2.amazonaws.com/activeeon-public/datasets/pima-indians-diabetes.csv.
Split_Data task from 3. Data Preprocessing. This task splits data into training and test datasets.
Train_Model task from 6. Train. This task trains a predictive model using the training dataset and based on the chosen algorithm.
Support_Vector_Machines Machines task from 5.2. ML Classification. This task specifies the algorithm that will be used for training the model.
Download_Model task from 2. Input and Output Data. This task downloads the trained model.
Predict_Model task from 7. Predict. This task predicts the results based on the trained model and the test dataset.
Preview_Results task from 2. Input and Output Data. This task exports the prediction results.
- Data Visualization bucket:
Visdom_Service_Start task from 1. Visdom. This task starts a Visdom Service that will be used to plot the predicted results.
Visdom_Visualize_Results task from 1. Visdom. This tasks transforms the predicted results into graphs that will be plotted in Visdom.
Visdom_Service_Actions task from 1. Visdom. This task stops the started Visdom Service.
- Notification Tools bucket:
Web_Validation task. This task pauses the job and send a validation message to the notification service.
This task is used in order to enable the user to stop the Visdom service once he finished using it.
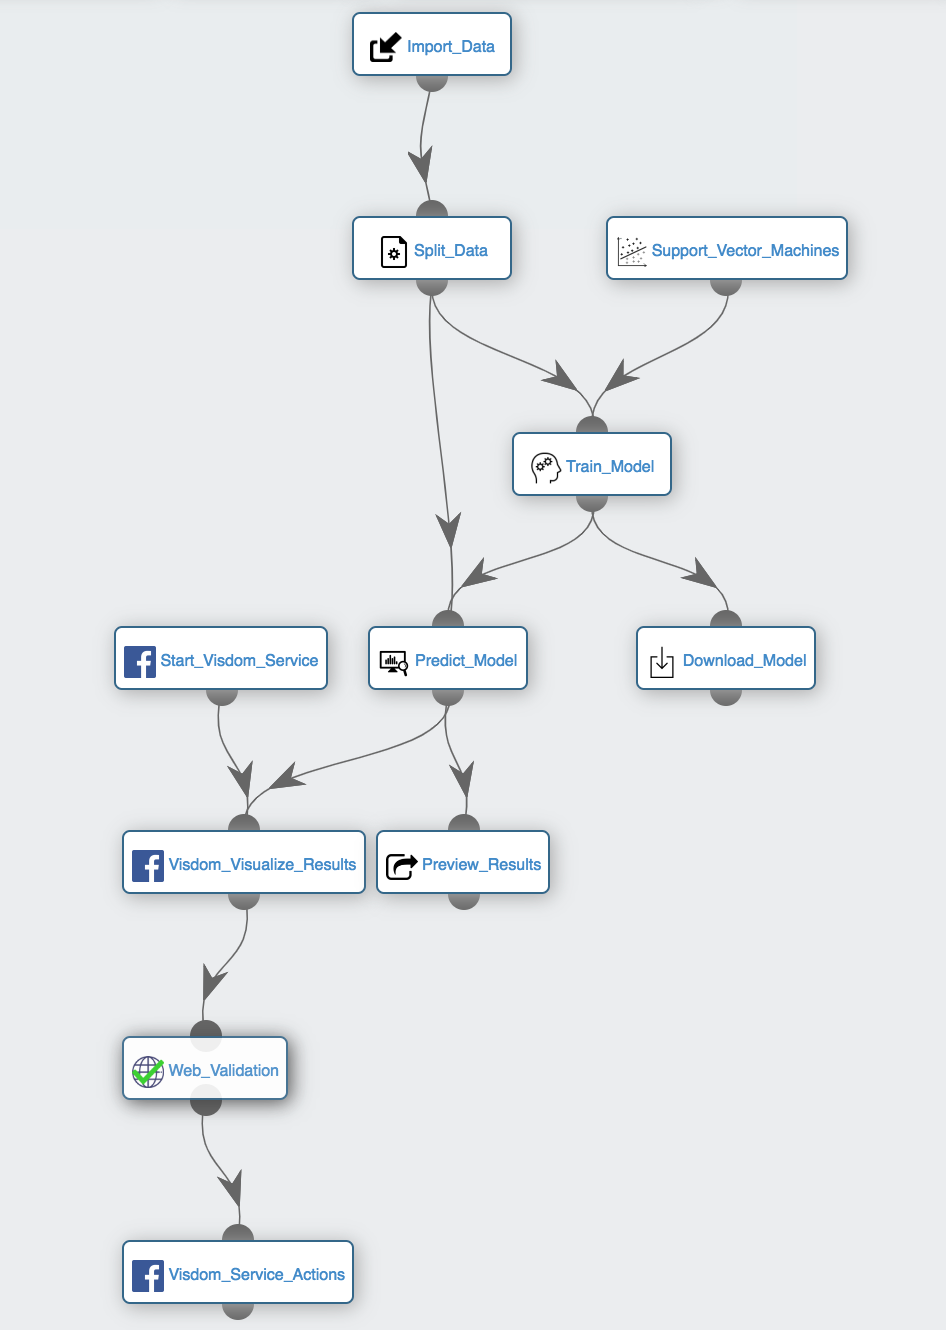
- Link the different Workflows in a way that you will have the following workflow:
- Set the variables of each task according to your needs. For example:
- Select the Split_Data task and use the following parameters in order to use 60% of the dataset for training and the remaing data for test:
TRAIN_SIZE: 0.6
- Select the Train_Model task and use the following parameters in order to specify the column containing the label:
LABEL_COLUMN: class
- Select the Predict_Model task and use the following parameters in order to specify the column containing the label:
LABEL_COLUMN: class
- Select the Visdom_Visualize_Results and use the following parameters in order to plot visualization highlighting people with diabetes:
TARGET_CLASS: 1
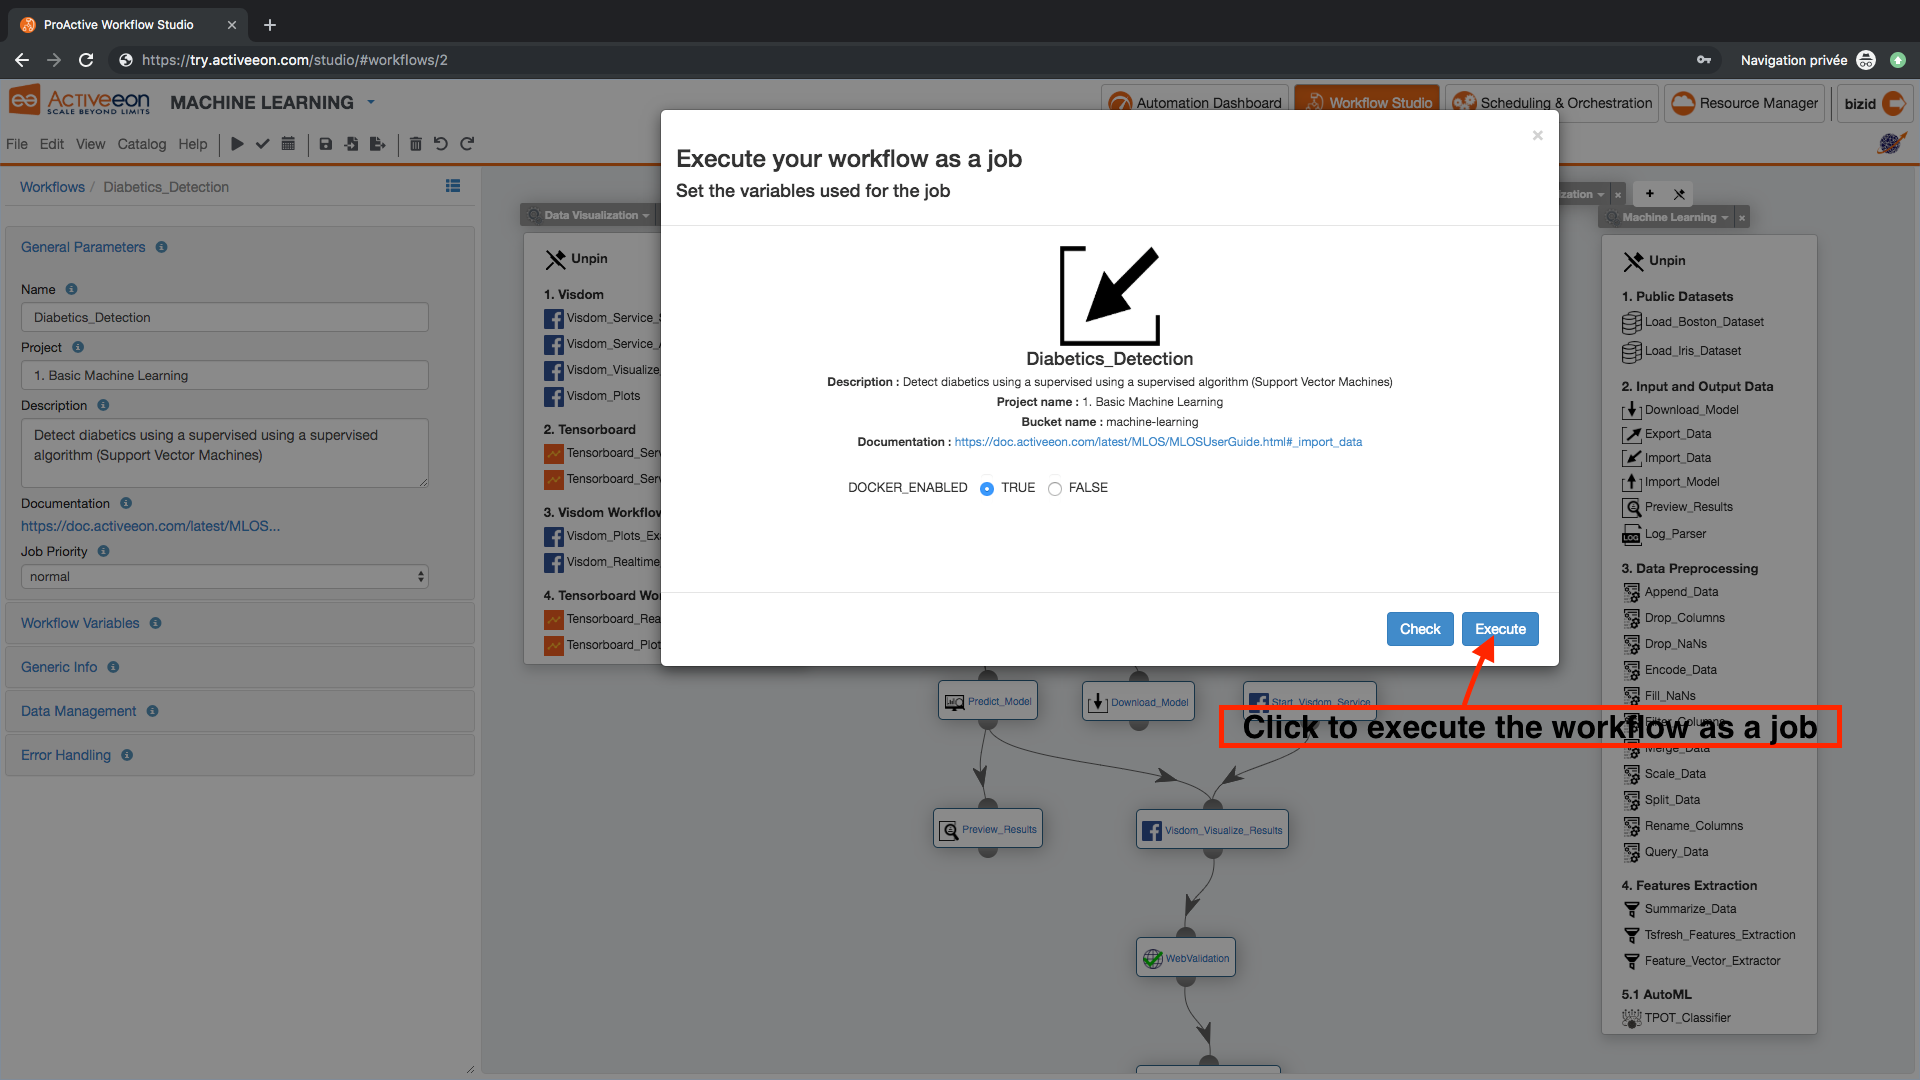
3 Submit and Visualize Results
- Press Execute and keep the following default workflow variables in the workflow variables dialog box:
- CONTAINER_PLATFORM: docker
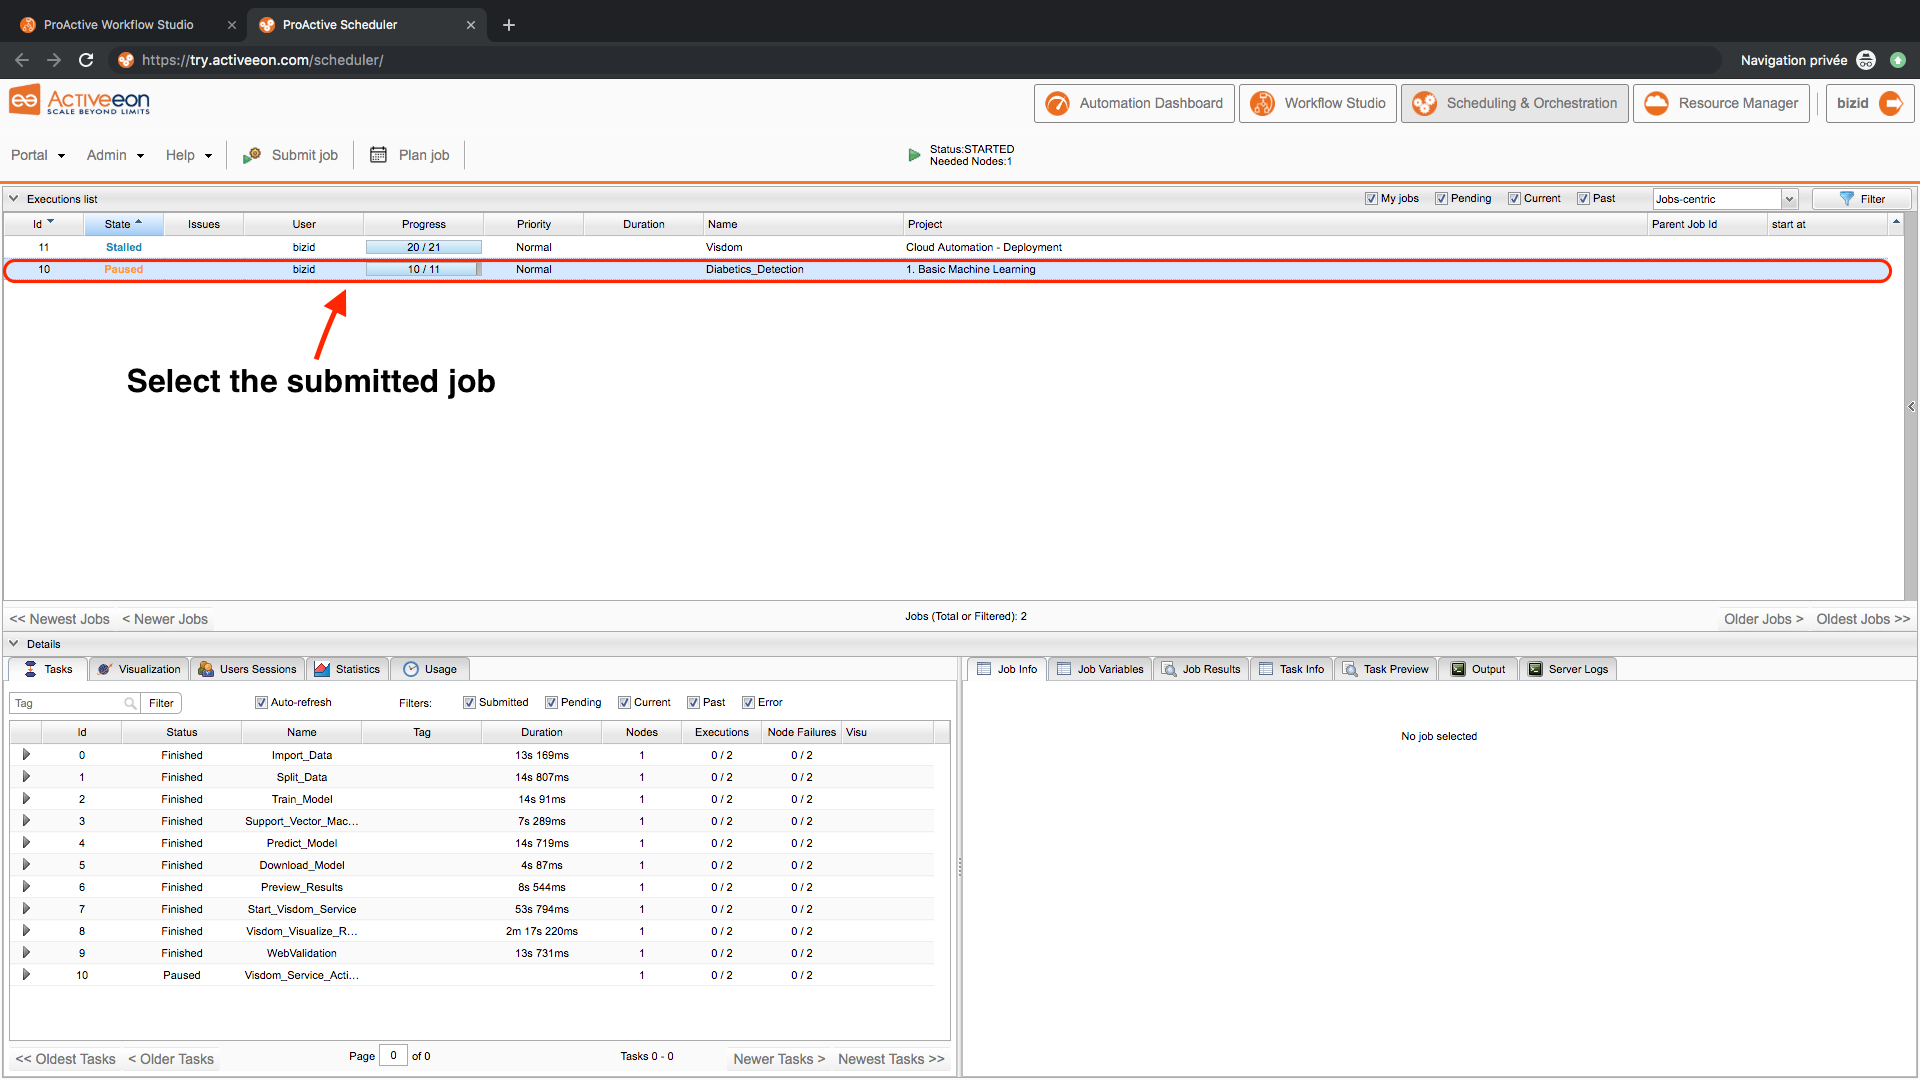
- Open the Scheduling & Ochestration Page and Select the submitted job to view detailed information about the tasks, the output, the execution times, and more.
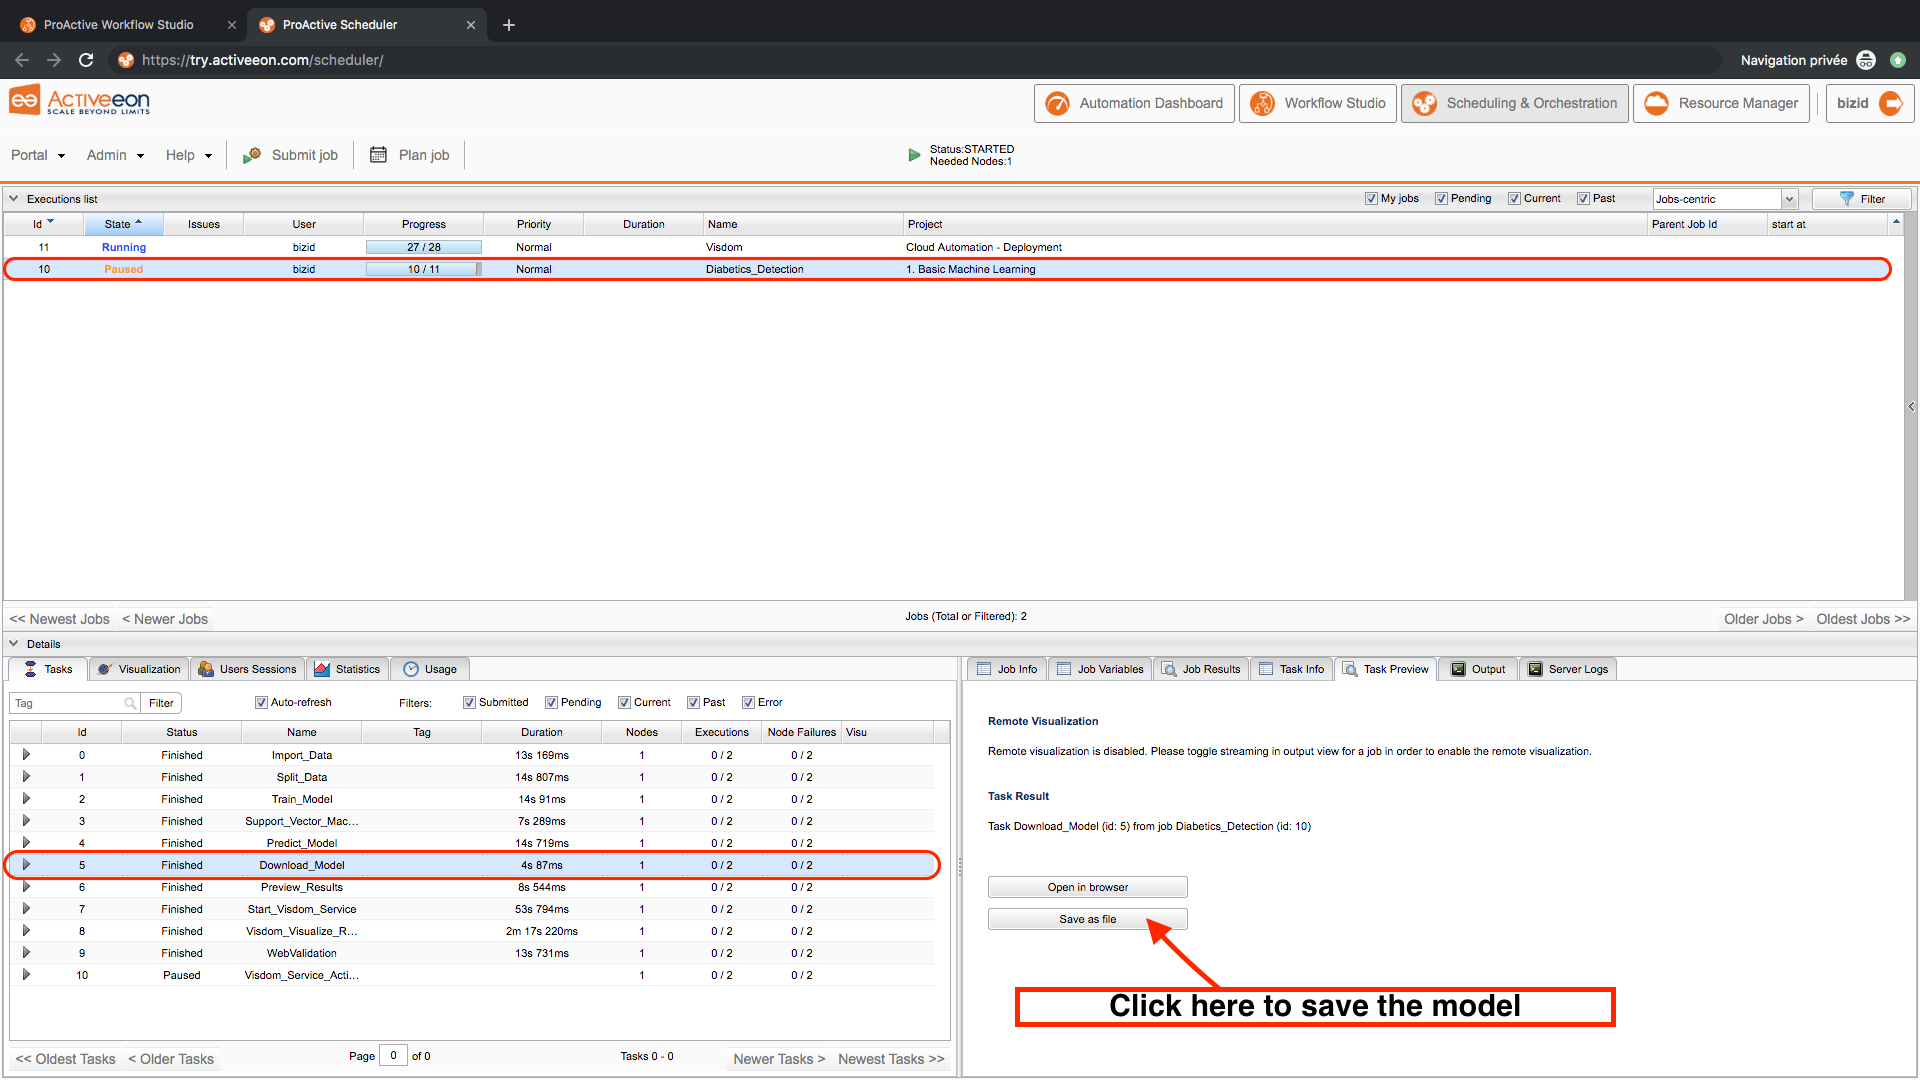
- Check the results:
- Click on the Download_Model task then click Save as file to download the trained model.
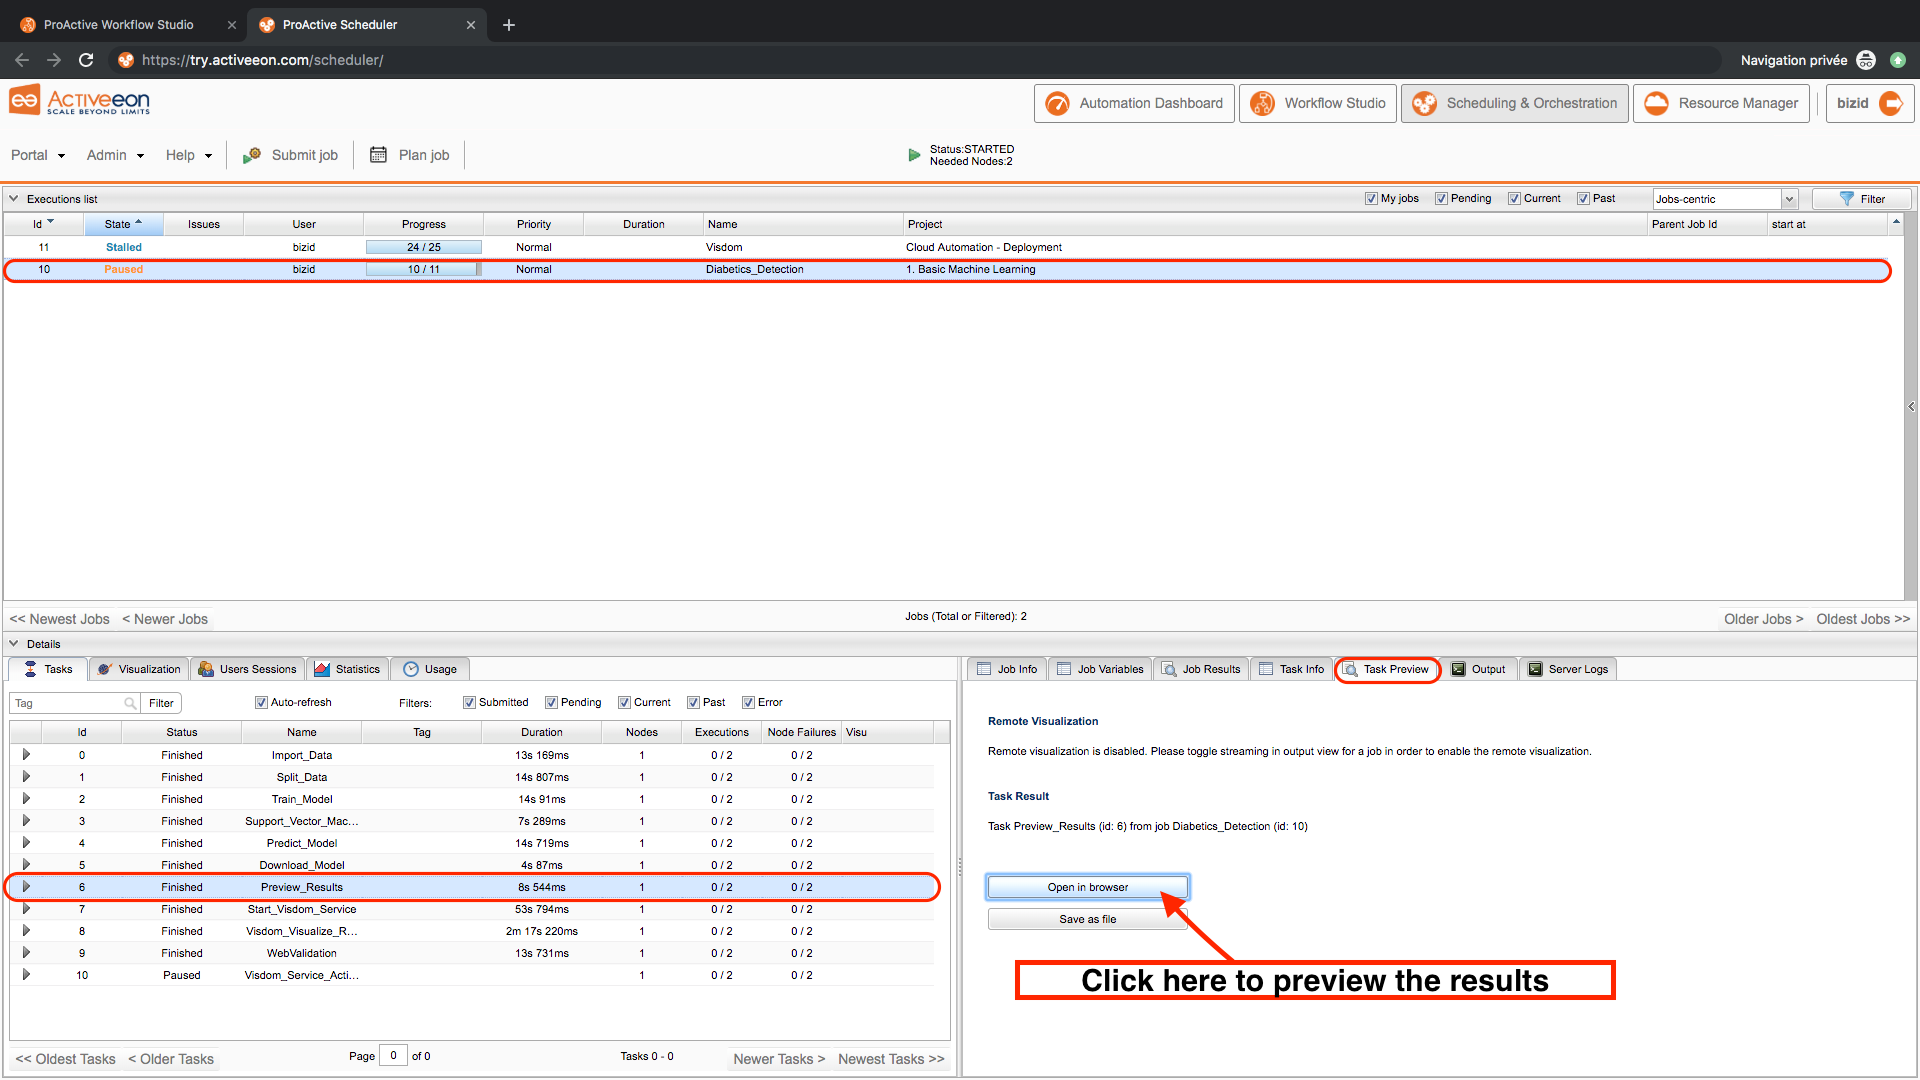
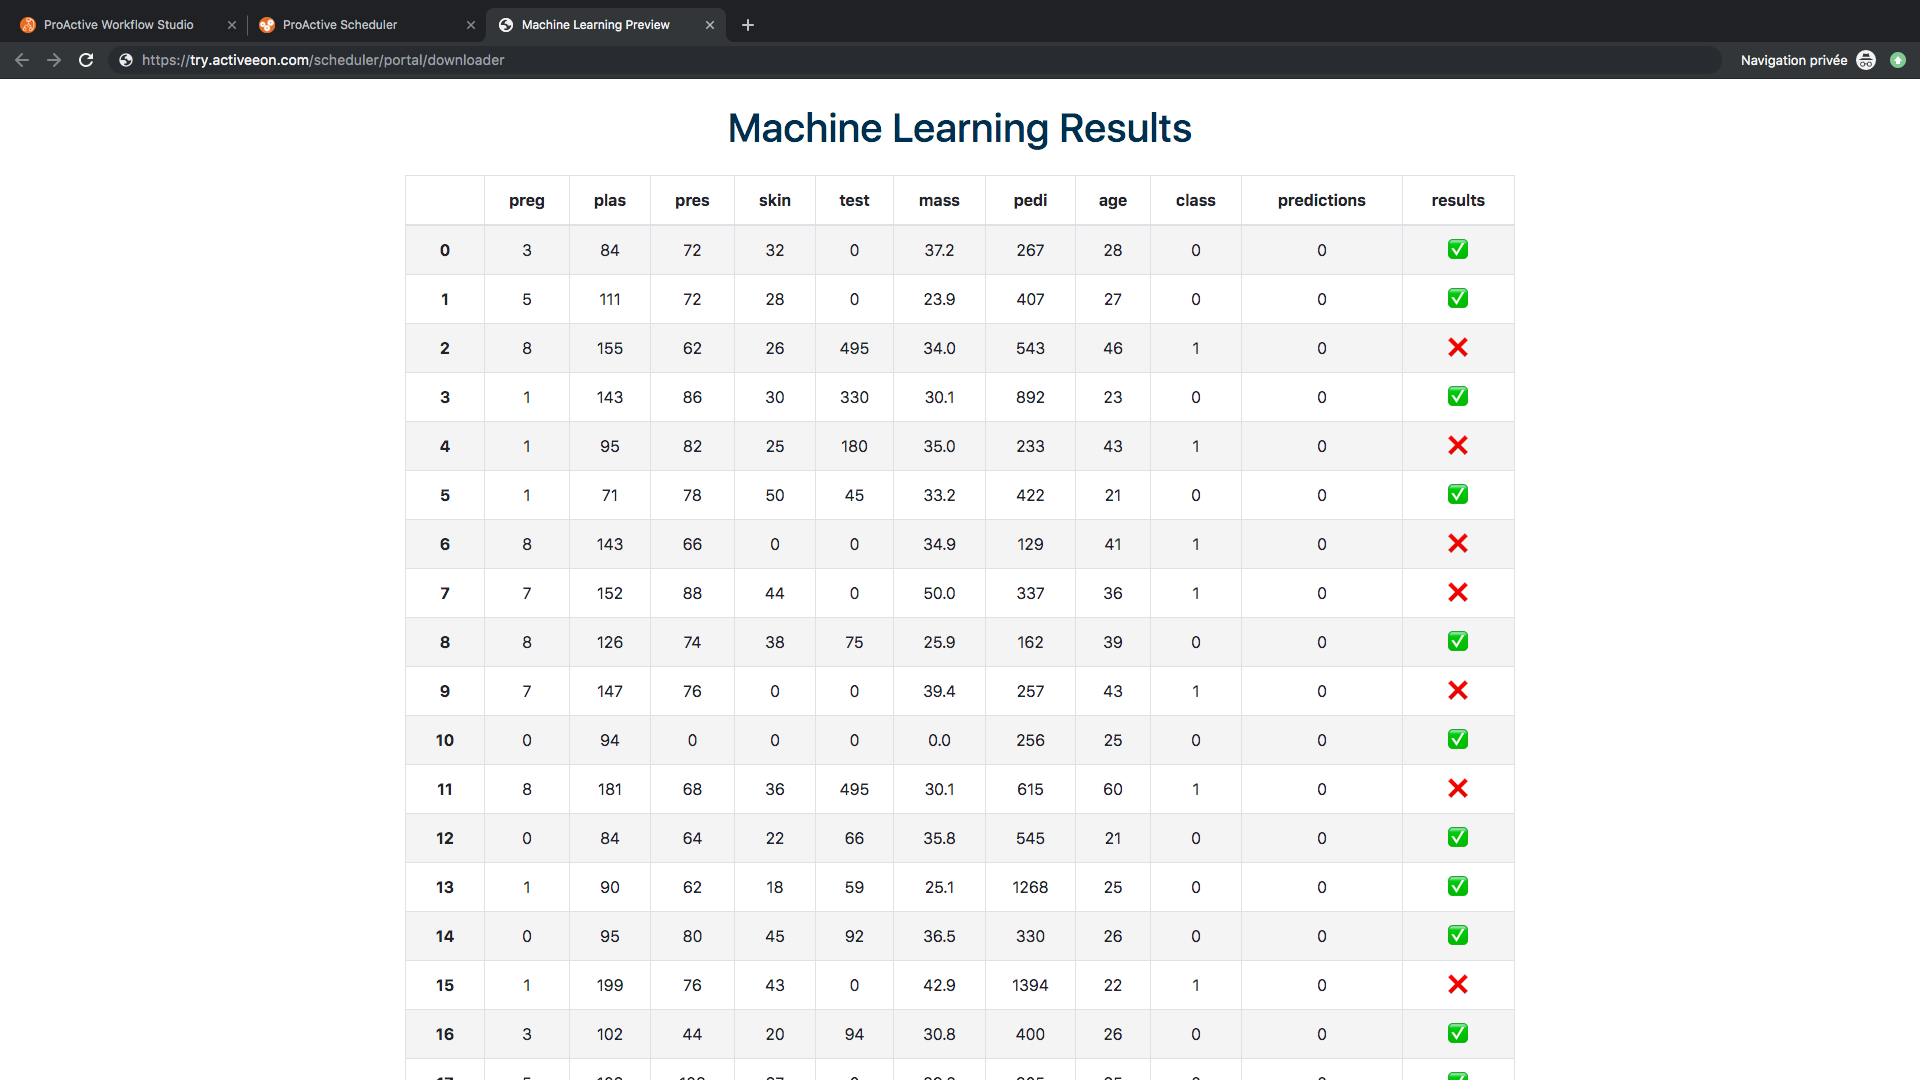
- Click on the Preview_Results task then click on Preview then click Open in browser.
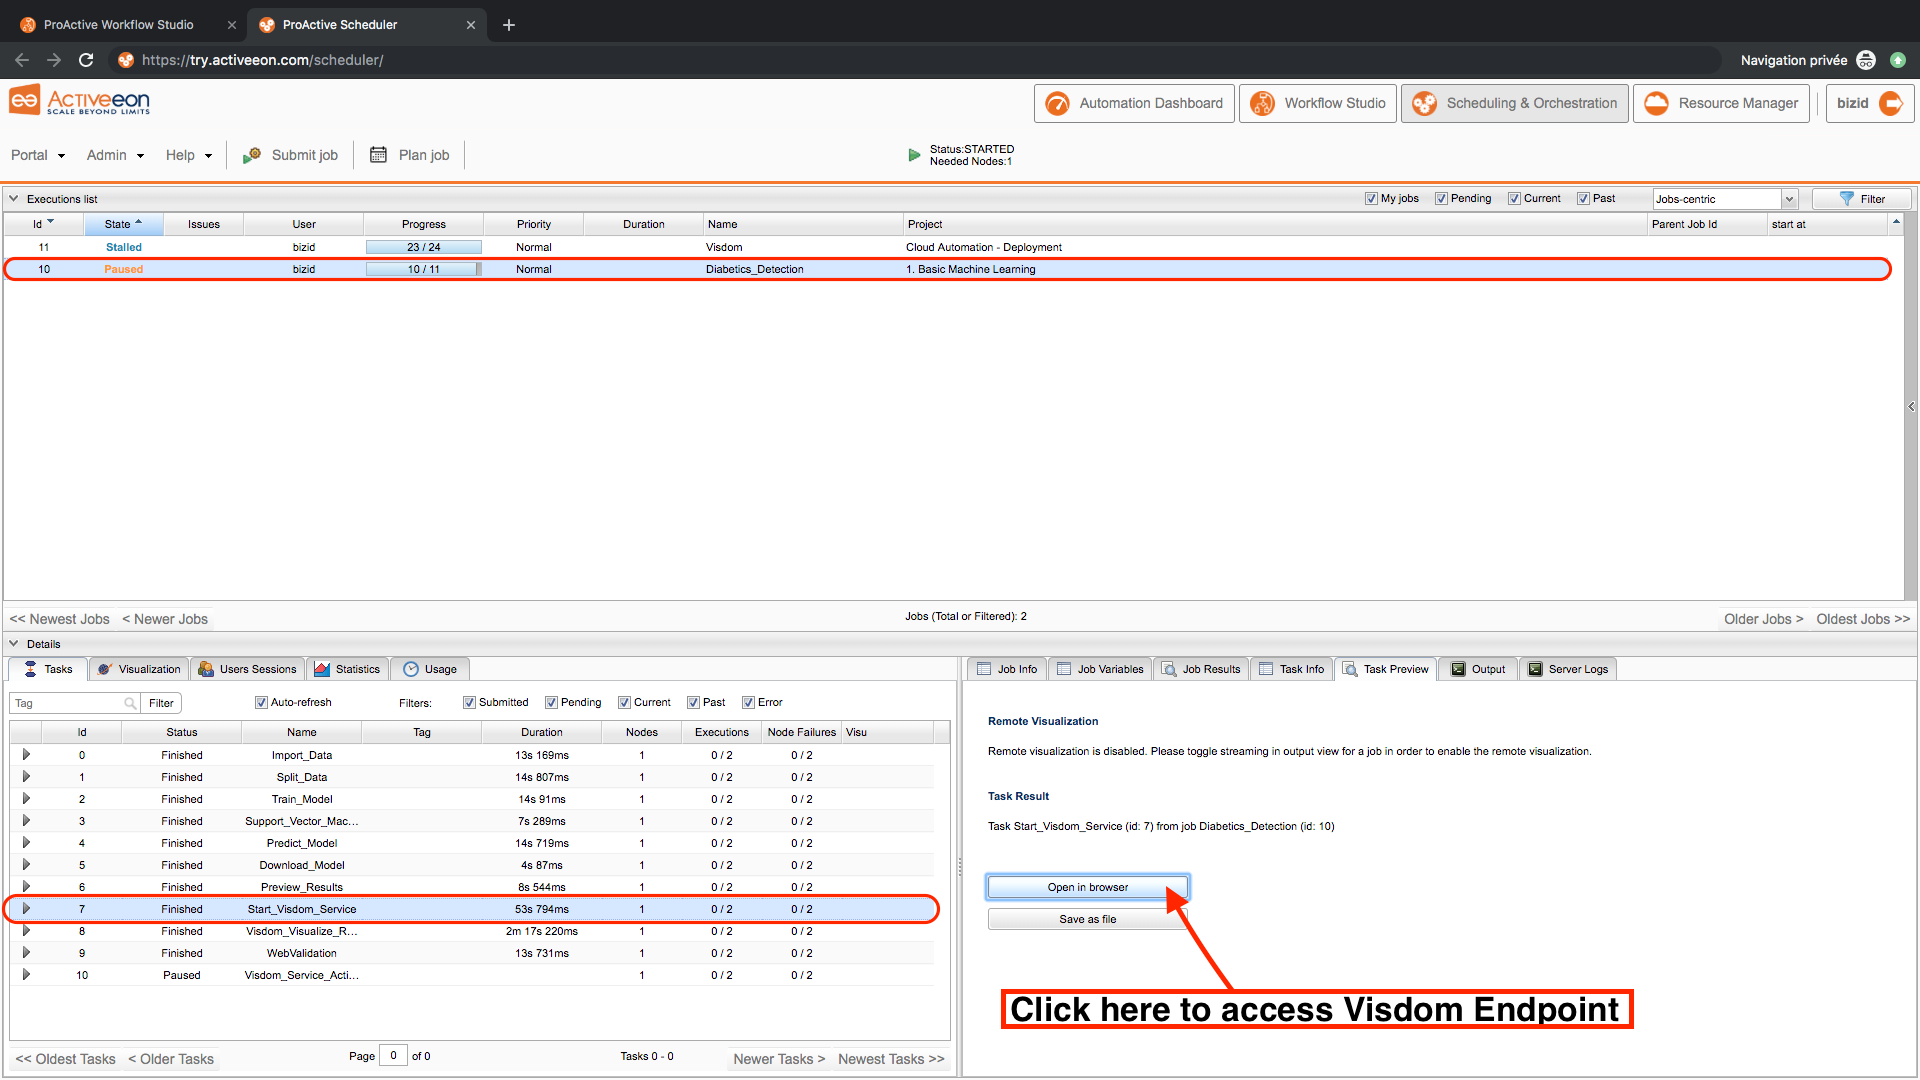
- Click on the Visdom_Service_Start task then click Open in browser then copy and paste the endpoint address in your browser.
- Open the Automation Dashboard Page and click on Notification Service and then click yes to validate that you are done with the visdom service and that the Visdom_Service_Actions task can be executed.
- watch PAIO demo video
- the tutorial on deep learning workflows
- go through our documentation for more details