ProActive Quickstart Scheduler Administration
In this chapter we present you some basic administration commands: how to manage nodes, users, where to find logs, and more.
1 Linux Server Installation
The basic installation only requires to unpack the ProActive archive and run (use .bat script for Windows environment):
- Http protocol is used in the portals (communications not encrypted).
- Default internal accounts are not changed (public login/passwords).
- The scheduler is not started as an operating system service (no reboot on restart).
- No versioning of configuration changes (handle upgrades).
- No housekeeping mechanism (job database can grow without limits).
Unpack the ProActive archive and become root (or use sudo). Then run:
- Supported operating systems: RedHat(CentOS), Debian.
- Requires Git, Unzip, Rsync (can install it automatically).
- Installs the scheduler by default in /opt/proactive.
- Manages multiple versions (symbolic links : default, previous).
- Can create an account used to start the scheduler or use a provided system account.
- Regenerates default internal users of the scheduler & symetric keys.
- Can configure the scheduler automatically to use PAM authentication.
- Can configure the scheduler web portals to start with a custom port, or with https (in this case, it will use the embedded self-signed certificate. Complete documentation for installing a certificate is available: https://doc.activeeon.com/latest/admin/ProActiveAdminGuide.html#_enable_https.
- Can configure House Keeping (automatic removal of old jobs).
- Can configure the network interface to use (scheduler binds to a single network interface).
- Installs the scheduler as a linux service (uses System V).
- Can retrieve user accounts, workflows from previous versions.
- Uses git to version configuration files, when upgrading a version, configuration changes are applied to the new version (conflicts can occur, which must be resolved).
- Output of the scheduler is stored in /var/log/proactive/scheduler.
- Commands to start the scheduler: service proactive-scheduler start | restart | stop | status.
2 Adding Nodes
Nodes can be added to the scheduler by:
- Using the Resource Manager portal (Node Sources). Refer to the Resource Manager tutorial.
- Installing a ProActive Linux Agent on machines. Refer to ProActive documentation https://doc.activeeon.com/latest/admin/ProActiveAdminGuide.html#_proactive_linux_agent.
Nodes need ProActive libraries in order to start, this can either be:
- The same archive as the ProActive server (shared installation, example: SSHInfrastructure).
-
The dedicated Node archive:
activeeon_enterprise-node-linux-x64-8.2.0-SNAPSHOT.zip -
The agent binaries:
ProActiveAgent-8.2.0-standalone-x64-setup.exe proactive-agent-8.2.0_SNAPSHOT-1.x86_64.rpm proactive-agent_8.2.0-SNAPSHOT_amd64.deb - The node.jar archive downloaded dynamically from the Resource Manager (example: Cloud Infrastructures). Node.jar is a one-jar archive containing all the ProActive node jars, and expanded dynamically on startup.
Depending on the procedure used to start the ProActive Node, a preliminary java installation may or may not be required.
This is because a Java Runtime Environment is shipped with ProActive distributions.
Thus, when using directly the ProActive distributions, Java installation is not required.
When using a Cloud Infrastructure (node.jar), the Virtual Machine referenced must contain a Java installation.
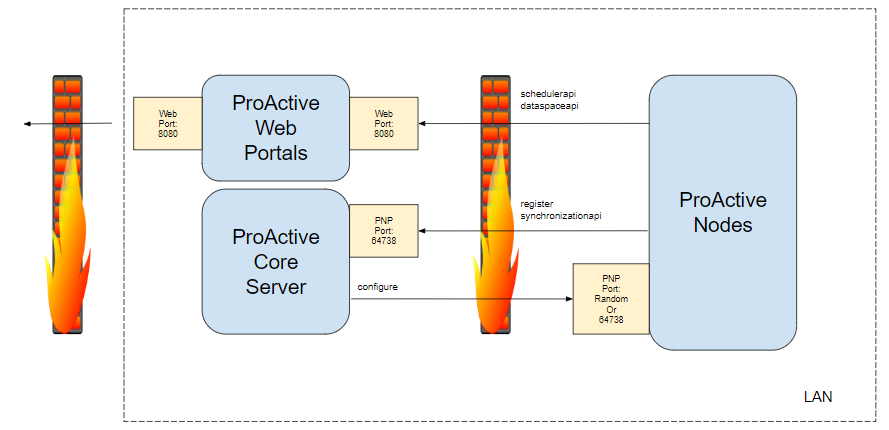
3 About Network Protocols
Network Protocols
Two categories of protocols:
- Web : for all portals and REST APIs.
- ProActive : for all communications between ProActive Nodes and Scheduler/RM servers.
- All portals communicate with microservices using REST.
- Command-line interface also uses REST.
- Java Client (called SmartProxy) uses REST and WebSockets (for asynchronous notifications).
- For Point-to-point communications : PNP (ProActive Network Protocol).
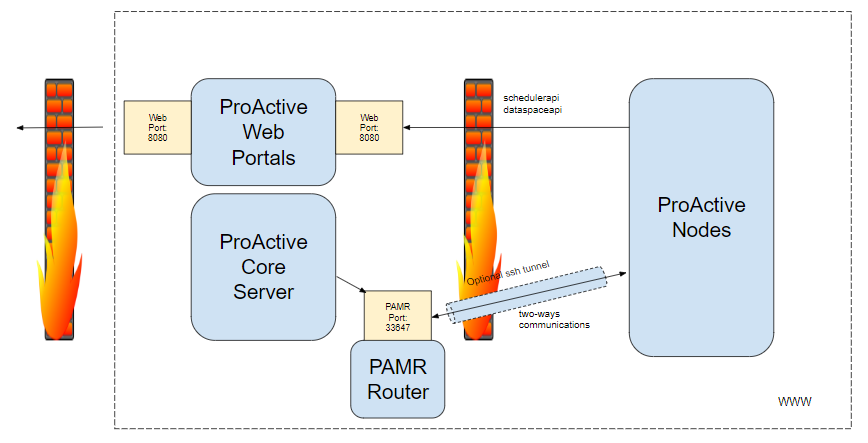
- For routed communications : PAMR (ProActive Message Routing)
PNP default port on the ProActive Scheduler server is 64738. When PNP is used in ProActive Nodes, a random free port is chosen (but the port can also be fixed using a property).
PNP urls are of the form pnp://hostname:port.
PNP must listen on both sides (node->rm, rm->node).
PNP performance is similar to the Java RMI protocol.
PNP can we wrapped inside an SSL tunnel: PNPS: pnps://scheme.
PAMR default port for both server and nodes is 33647.
PAMR communications can be tunnelled using SSH (through a configurable private SSH key).
PAMR is slower than PNP.
PAMR urls are of the form pamr://agent_id.
Network protocols can be configured on the server using:
- Java properties when creating node sources in the Resource Manager.
- Agent configuration files when using Windows/Linux agents.
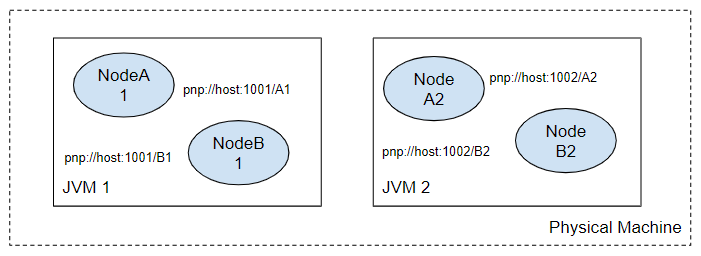
Nodes Co-allocation
TA Node is executed inside a Java Virtual Machine, but a single JVM can contain multiple ProActive Nodes. This functionality is called Co-Allocation and is illustrated in the following diagram (example for PNP) :
4 Logs & Data Files
ProActive Scheduler internal logs are stored in :
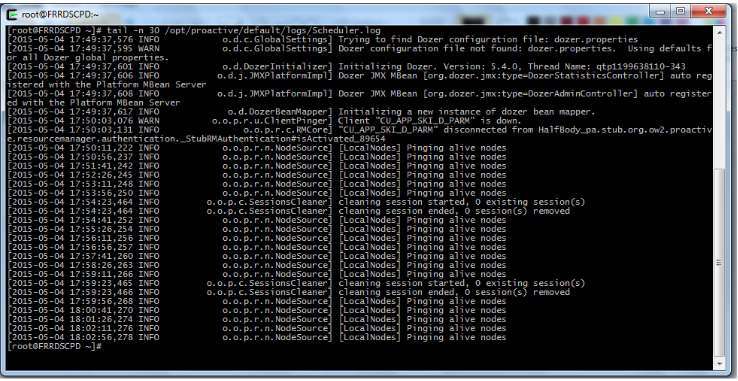
Log files exists for each micro service :
Log files also exist for each node.
Depending on how the nodes are started, logs can either be:
- In a shared location when using an SSHInfrastructure
- Inside a cloud instance when using cloud infrastructures
- In a configurable path when using agents
- etc...
The data folder files of the scheduler are stored at SCHEDULER_HOME/data.
It contains the following folders:
- db/rm : database of the resource manager (memorizes all node sources deployed and rm statistics).
- db/scheduler : database of the scheduler (memorizes all user jobs).
- db/catalog : database of the catalog.
- db/notification : database of the notification service.
- db/pca : database of the ProActive service automation.
- default[input/output/global/user] : data spaces stored on the server (User Space, Global Space, etc).
- The user workflows are stored in defaultuser\[username]\workflows .
5 Managing Users
Managing Internal Users
The ProActive Scheduler has an internal user management system. Internal users passwords and group affectations are defined in the files:
To add a new user, the following command can be used:
To modify an existing user (for example to change a user password):
Managing External Users
In addition to users managed directly by the scheduler, users from an Active Directory can be added through:
- A LDAP configuration.
- A PAM configuration.
-
Editing (parameters such as LDAP server, credentials for the LDAP server, LDAP
filters must be entered):
SCHEDULER_HOME/config/authentication/ldap.cfg -
Editing (to enable LDAP authentication):
SCHEDULER_HOME/config/scheduler/settings.ini SCHEDULER_HOME/config/rm/settings.ini
User Roles
Groups authorization are implemented using JAAS.
A single file defines what groups can or cannot do:
JAAS model allows to easily modify existing groups or create new groups.
Server Keys
We have seen that login.cfg contains encrypted passwords.
They are encrypted using the public key of the scheduler.
Symetric scheduler keys are stored in:
A new key-pair can be generated manually using:
Credential Files
Credential Files are files containing the encrypted credentials of a single
user.
Credential Files may be used to log into the scheduler, to create node sources, etc.
The ProActive Server uses 3 credentials files internally:
Accordingly, if the password of the rm internal user is changed, the rm.cred file must be regenerated.
Credential files can be generated using the command (or in the Sched. Portal):
6 RM Portal
The Resource Manager Portal allows an administrator to perform several tasks such as :
- Managing node sources, nodes on any infrastructure (public/private cloud, local machine,..).
- Locking ProActive Nodes to prevent tasks to be executed on them.
- Executing scripts directly on a given node.
- Monitoring resources and processes (Memory, Disk, Network, CPU).
Monitoring
To monitor the host metrics click on the computer icon in the tree view on
the
left panel, and then click on the tab Monitoring:
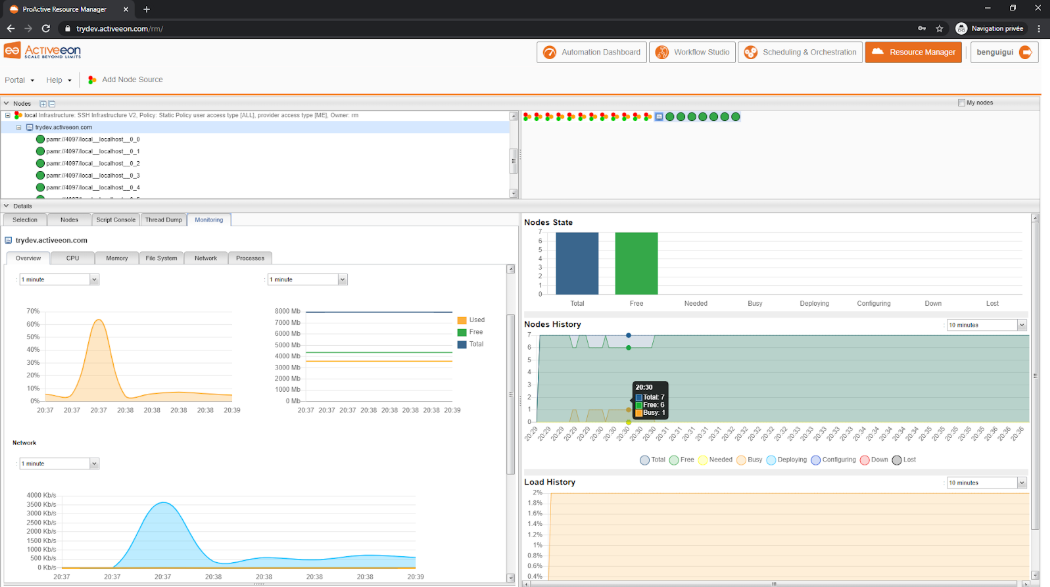
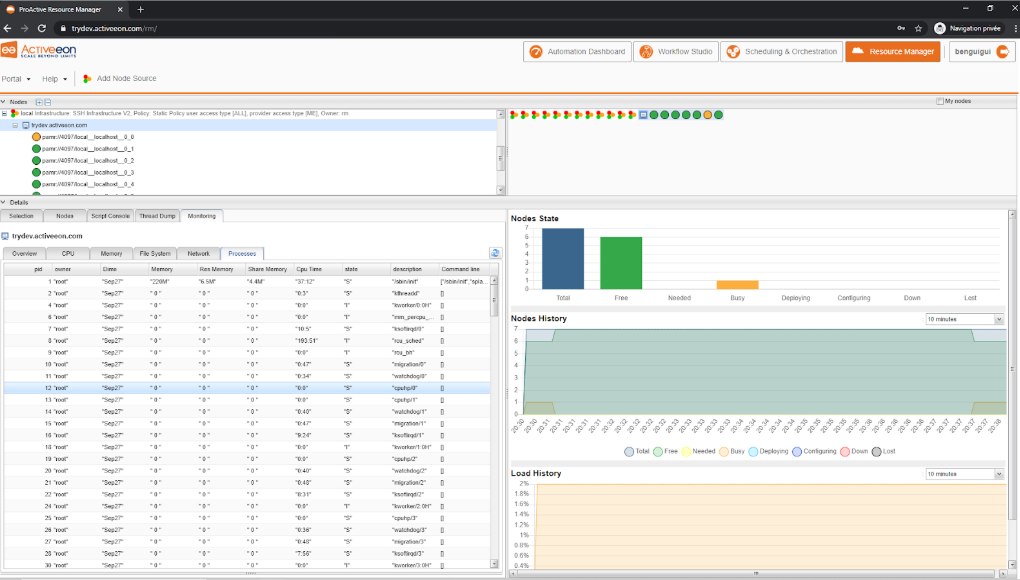
You can browse the different metrics by selecting the different tabs (CPU, Memory, File System, etc…):
The metrics related to the computer icon is not only related to ProActive, it shows as well the activity of other processes on this computer.
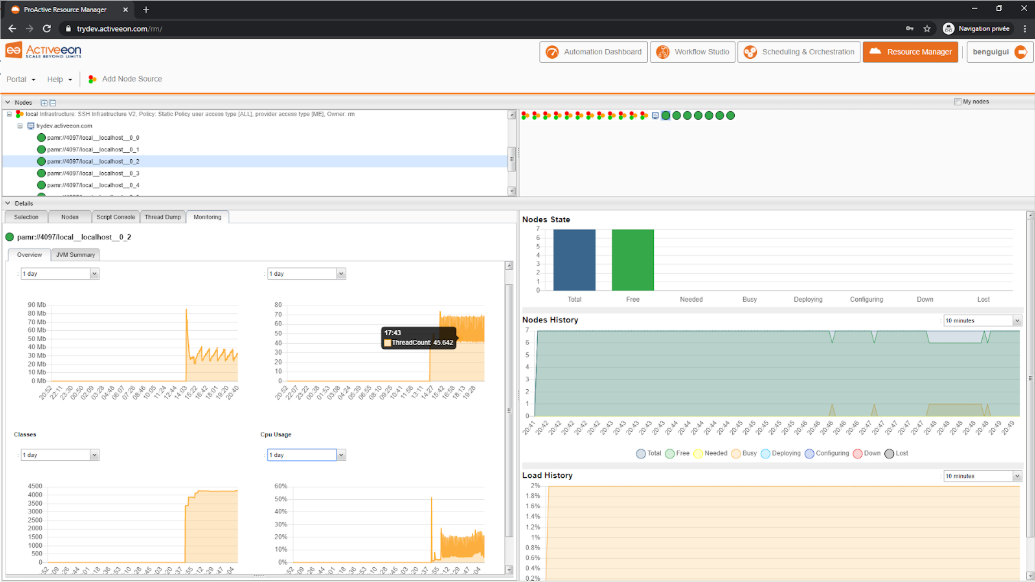
It is possible to display the metrics related to a single ProActive node (JVM process). In order to do so, select a green disk, and then Monitoring.
This view displays the status of this Node JVM (number of Threads, heap, cpu usage) :
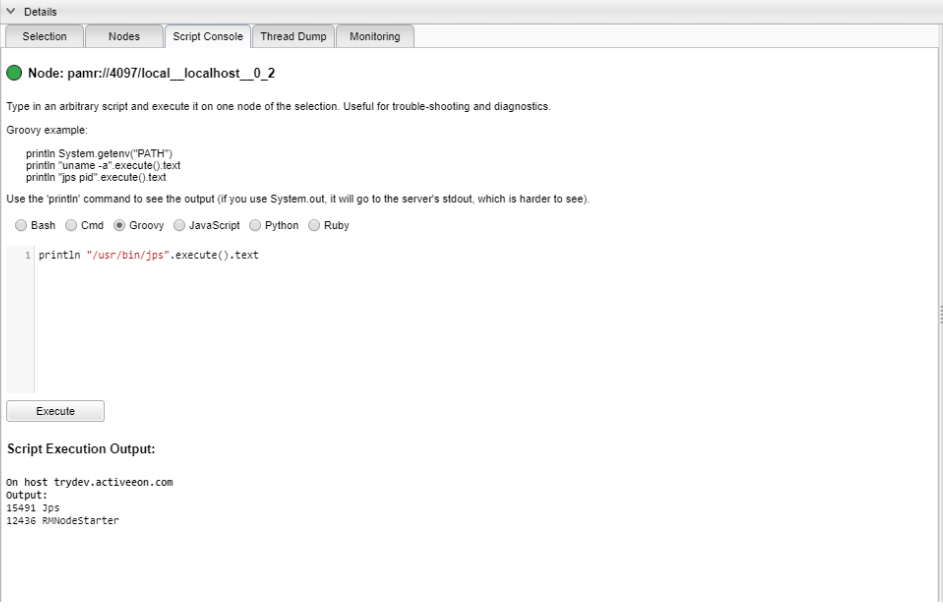
Script Console
On a selected ProActive Node, it is also possible to execute a script, you can do
that
by selecting the tab Script Console.
For example, execute the command to print the processes executed on this machine and
their pid:
Infrastructures
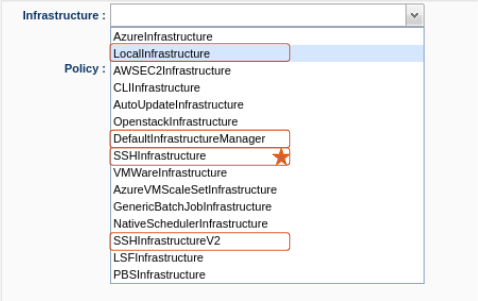
-
Local infrastructure:
Can be used to start nodes locally (i.e, on the host running the Resource Manager).
Requires manual nodes deployment. -
Default infrastructure Manager:
Simple way to acquire new static nodes (eg. one infra per cluster, type, ...).
Requires manual nodes deployment. -
SSH infrastructures:
(Include deprecated SSHv1 version)
Acquire multiple nodes/machines from a list of IP addresses.
Start nodes using the ‘node.jar’ downloaded from API through SSH.
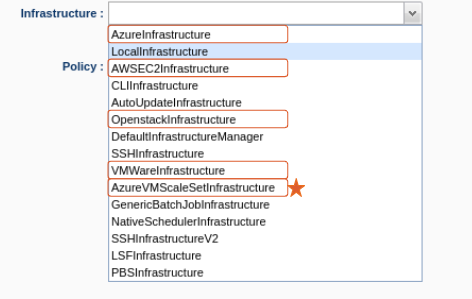
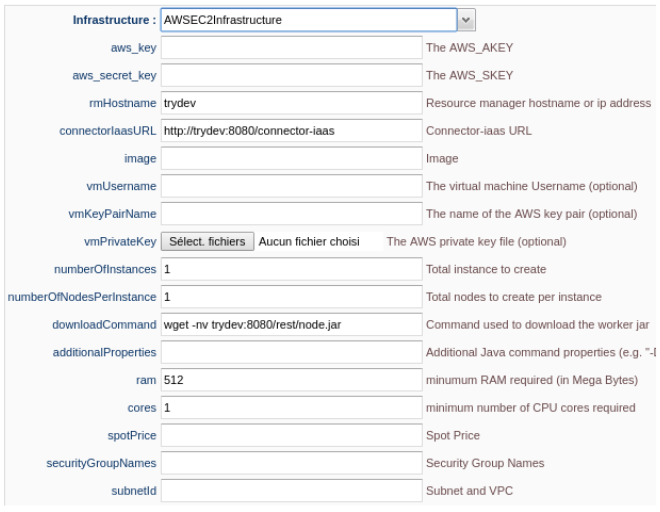
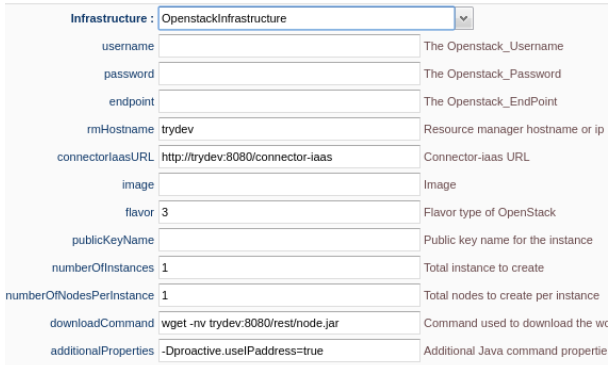
- AWS & OpenStack (JClouds library).
- VMWare (Unofficial YaviJAVA library).
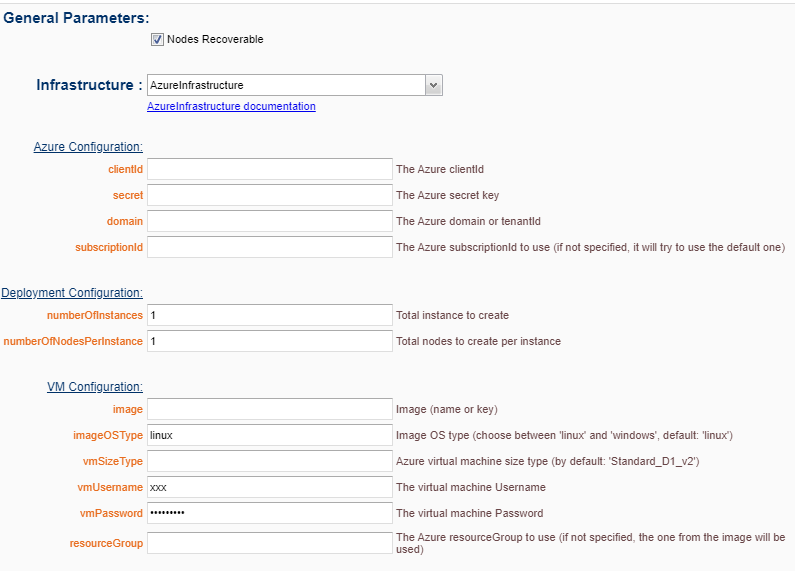
- Azure (Official Java SDK).
Amazon:
OpenStack:
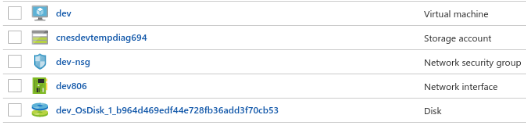
Azure VM Deployment behaviour:
- Same subnet.
- Linux/Windows.
- SSH public key / password.
- Init script from Azure.
- Extensions feature.
- Deploys multiple VMs in parallel.
- 1 public IP per VM.
- VMs managed separately.
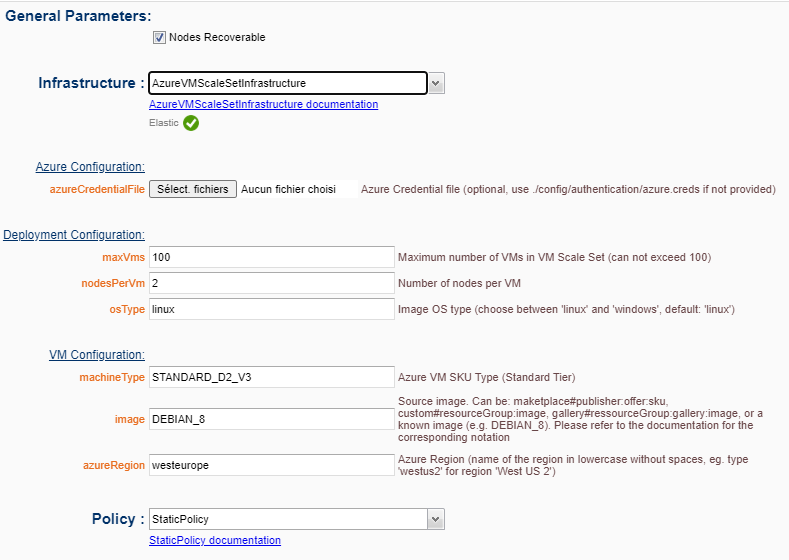
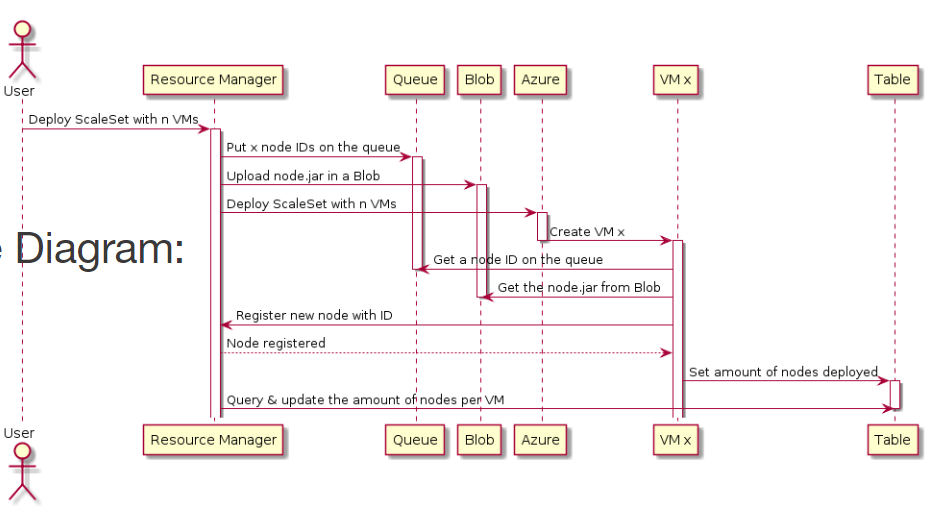
Azure ScaleSet Deployment behaviour:
- Deploys all VMs in a single infrastructure.
- Azure “ScaleSet” resource.
- SSH public key / password.
- Fully customizable init scripts.
- 1 public IP for all the VMs to deploy.
- Easy to scale up/down.
- Overprovisioning features.
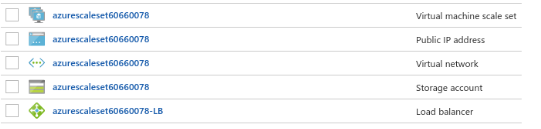
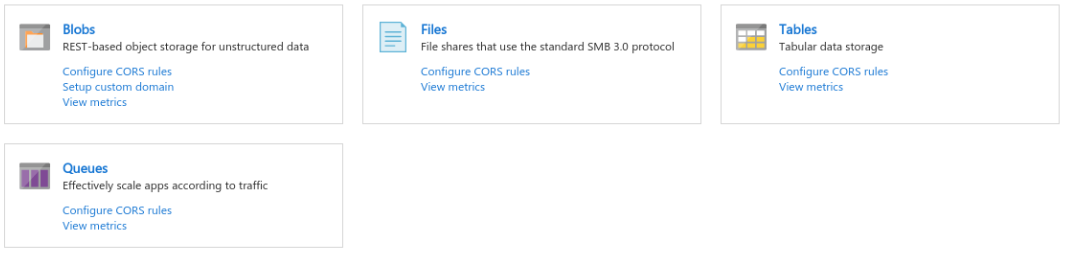
Multiple Azure storage resources used:
- Blob container.
- Queue.
- Table.
Sequence Diagram:
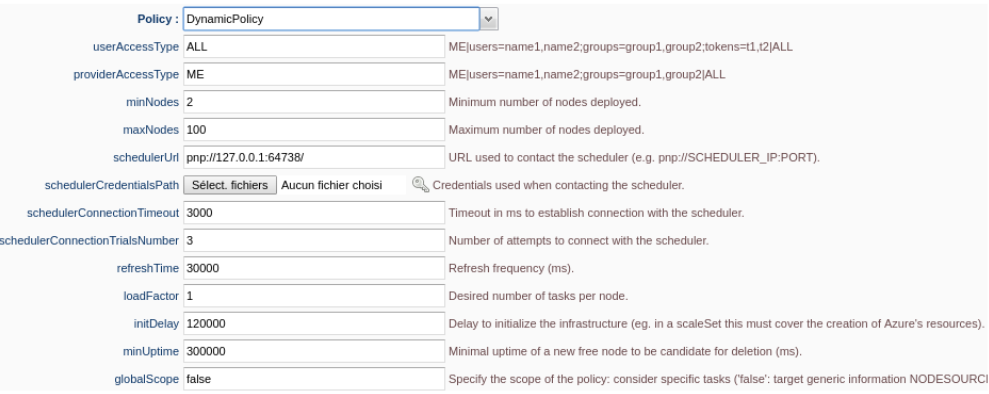
Static Policy:
- AcquireAll nodes from the infrastructure (eg. maxVMs).
- Extra nodes can be removed manually<;
- Unable to re-add removed nodes.
- Connect to the scheduler to analyse the queue of tasks.
- Interact with the RM to probe global nodes status.
- Limited VS global scope behaviours.
- Smart de/allocation (delete VM at once, big VMs first, uptime reached, etc.).
7 Scheduler Portal
The Scheduler Portal allows an administrator to perform several tasks such as :
- Monitoring the current state of jobs and each job details (number of tasks, logs).
- Killing or pausing running or pending jobs.
- Changing a job priority.
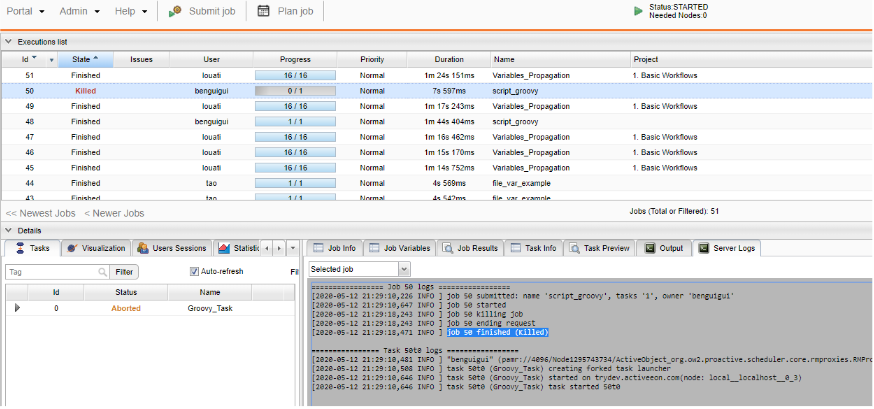
- Viewing server-side logs for every jobs.
- Viewing currently connected users.
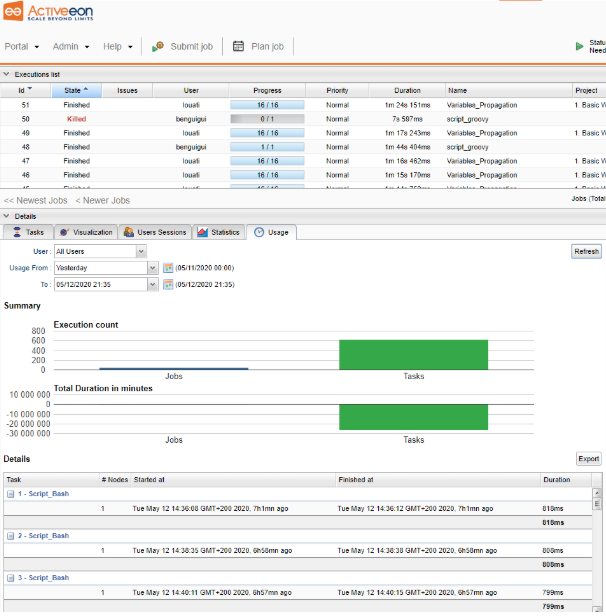
- Viewing the usage statistics of a given user.
- Controlling the scheduler.
In the task script write the following code (it will wait for 100 sec):
From the scheduler interface, select the job, right click on it and select Kill Job.
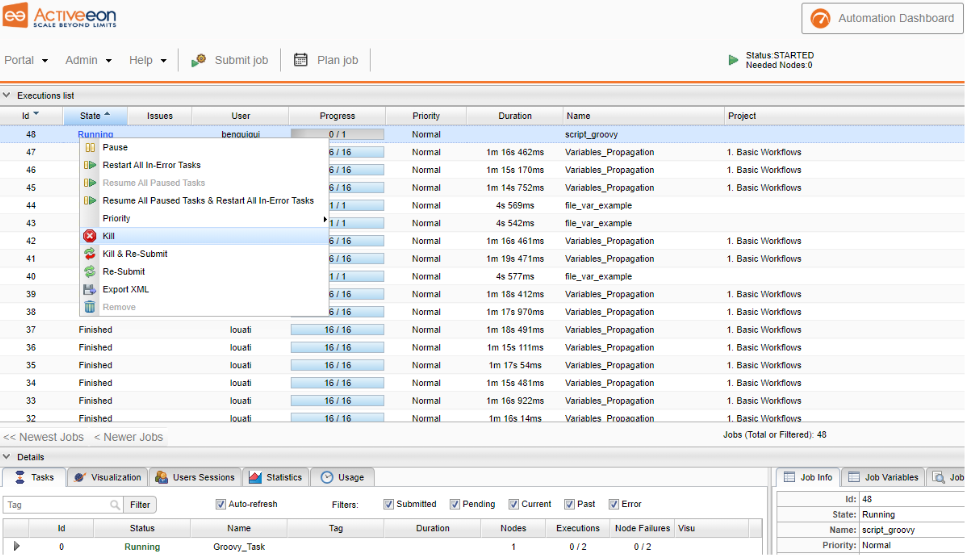
Similarly you can pause a job instead of killing it. A paused job will not execute new tasks until it is resumed (though it will finish the execution of its currently running tasks).
You can as well change a job’s priority from the drop-down menu, a job with high priority will be scheduled before lower priority jobs.
In order to access server-side logs, you need to select a job, then the tab Server Logs, and then click on Fetch Output, do that for the job you just killed :
In order to view a user’s statistics, click on the tab Usage in the bottom, select the user All Users, select a time window, and then click on Refresh
You can control the Scheduler State in the Admin menu:
- Started : schedule jobs and tasks normally.
- Paused : execute only current running jobs.
- Stopped : execute only current running jobs, does not accept new jobs submission.
- Frozen : execute only current running tasks (but accepts new jobs submission).
8 Command Line Interface
Additionally to the portals, it is possible to interact with the scheduler and RM by
using a command line interface.
It allows the same operations as the portals, but with the command line.
For example, connect to the scheduler machine and open a terminal. Enter :
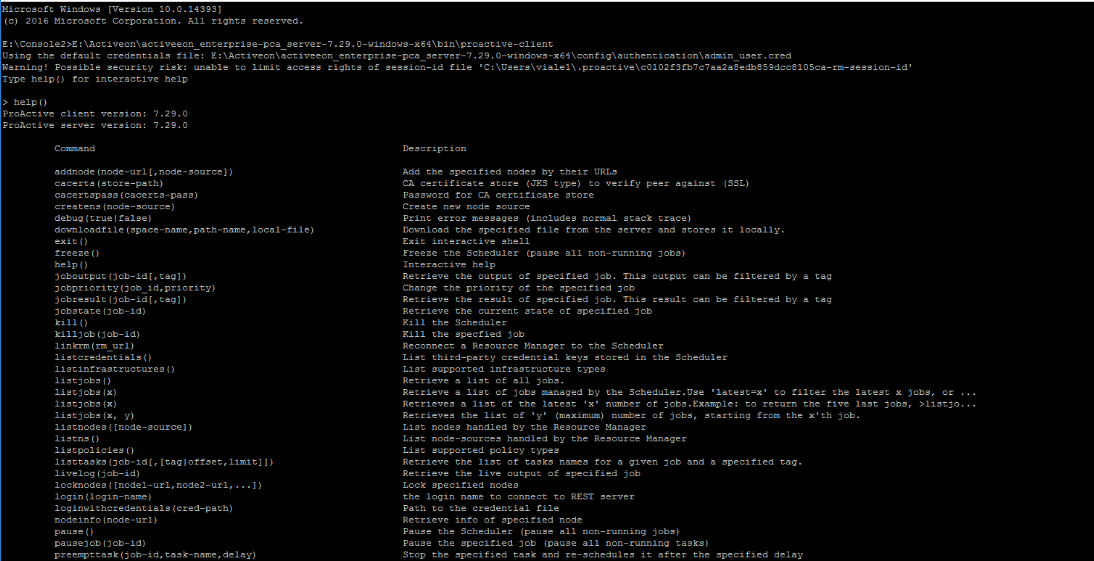
Type
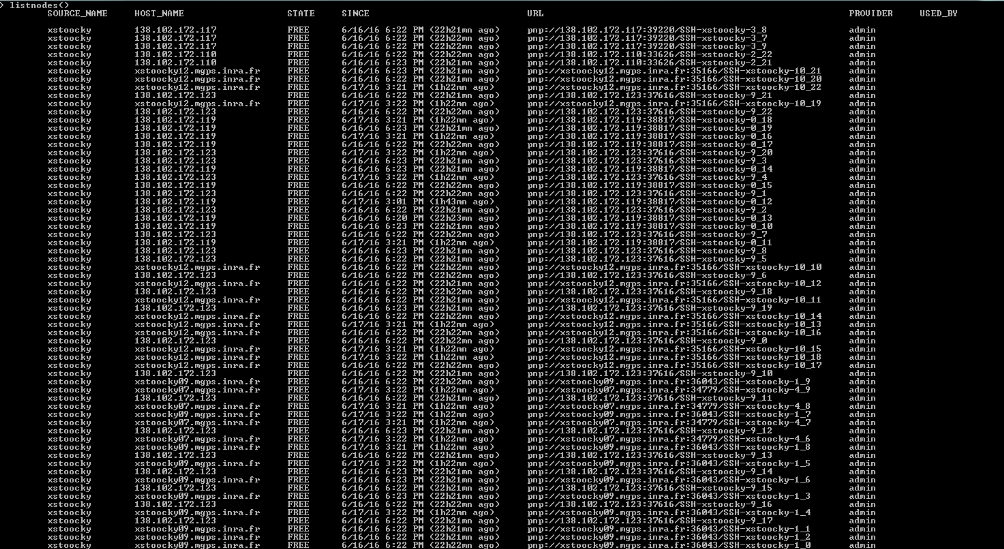
You can submit workflows using the CLI, for example, type:
Type